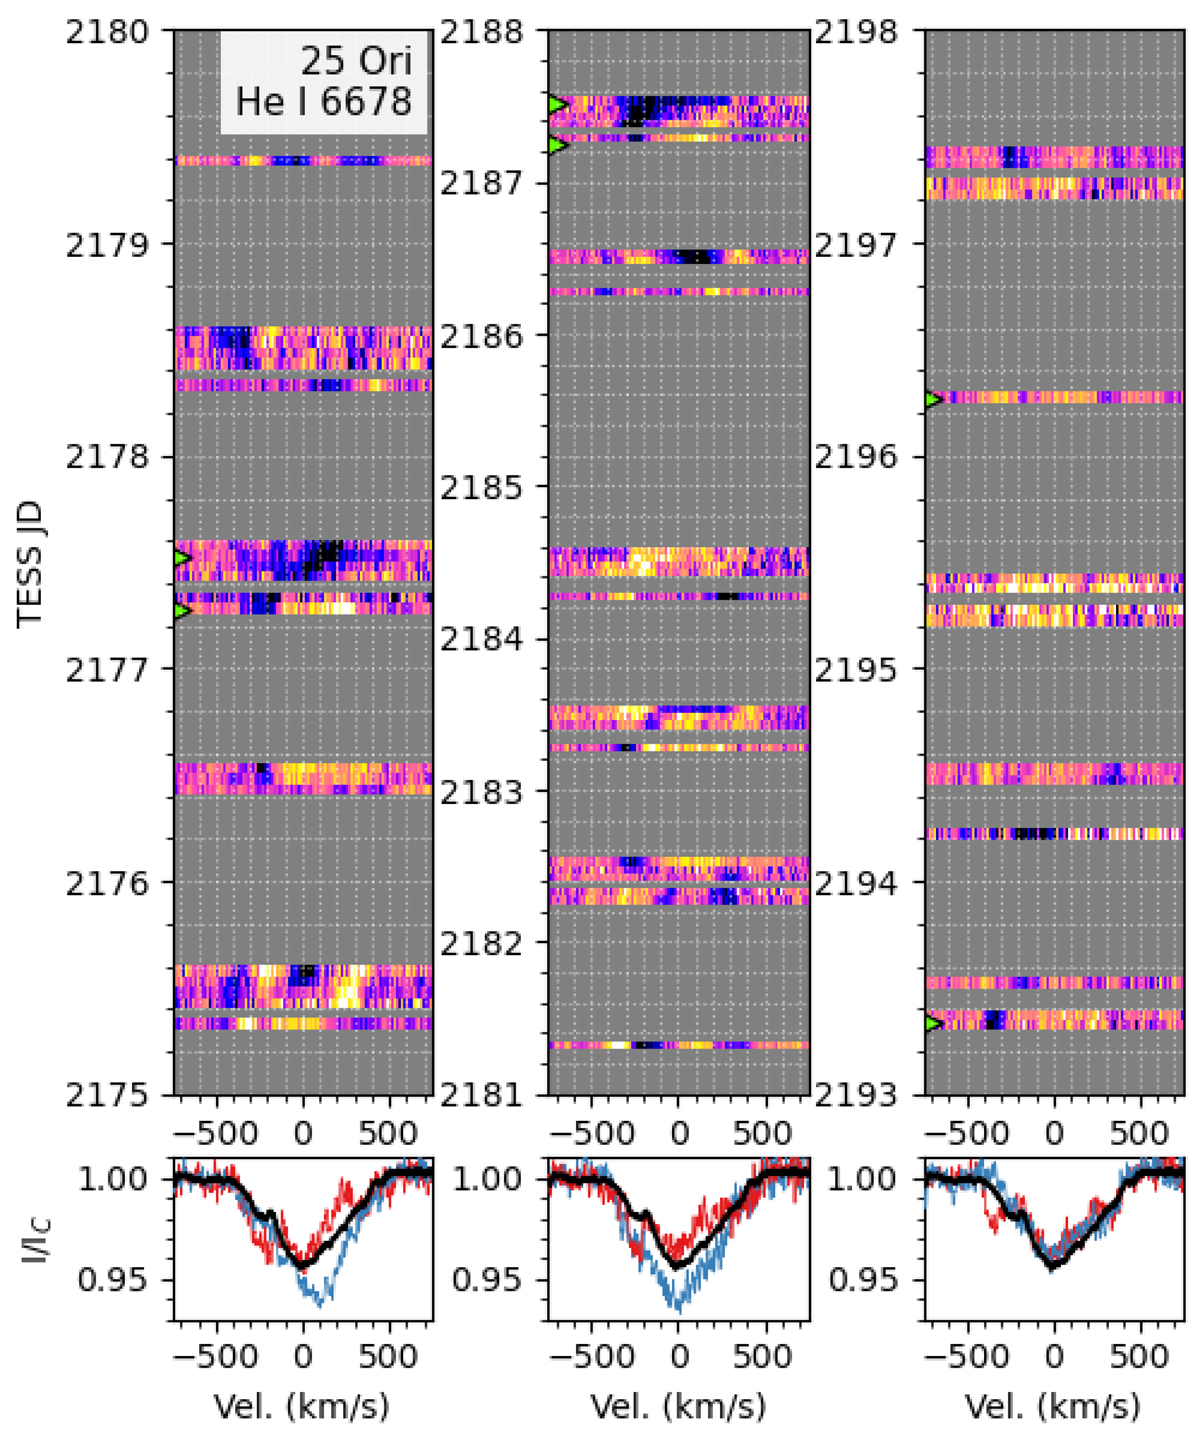
Fig B.9.
Download original image
Dynamical spectra of the mean-subtracted He I λ6678 line during the epochs indicated in Fig. B.8 (top panels). Bottom panels: Mean line profile in black, and two selected epochs (indicated by green triangles in the top panels) to emphasize the strong and fast line profile variations especially in the first half of the dataset (the red line profile precedes the blue).
Current usage metrics show cumulative count of Article Views (full-text article views including HTML views, PDF and ePub downloads, according to the available data) and Abstracts Views on Vision4Press platform.
Data correspond to usage on the plateform after 2015. The current usage metrics is available 48-96 hours after online publication and is updated daily on week days.
Initial download of the metrics may take a while.