Fig. 2.
Download original image
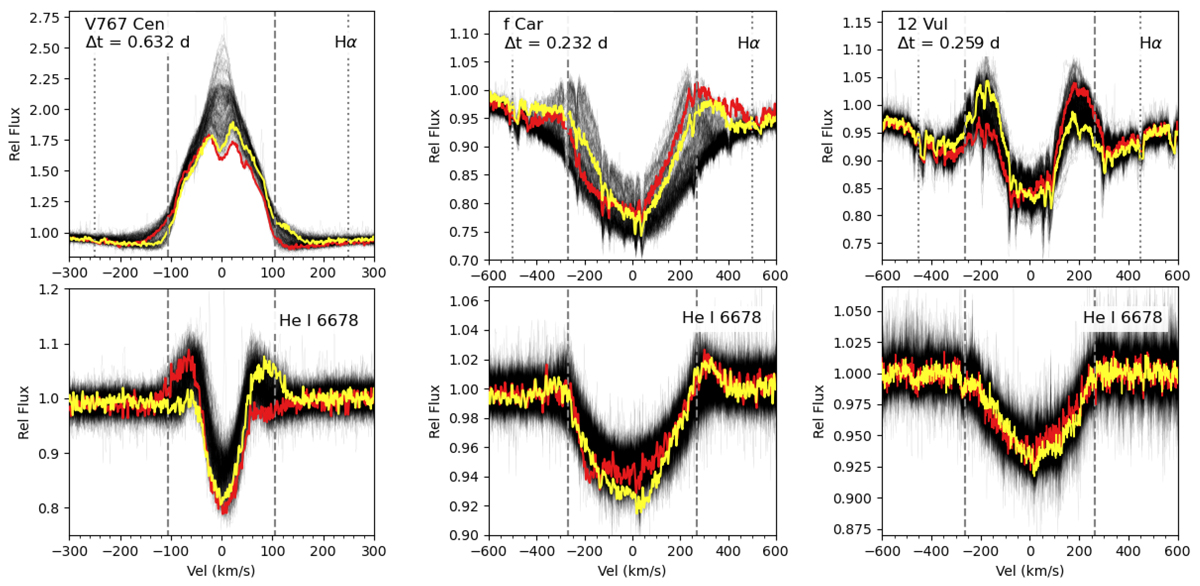
Line profiles of Hα and He I λ6678 for all observations (black) of V767 Cen, f Car, and 12 Vul. For each star, the red and yellow curves are taken near to the start of a flicker, being separated in time by the amount printed in the top panels (the red curve is the earlier of the two). The dashed vertical lines are the literature v sin i values, and the dotted lines are the integration limits for EW and EWV/EWR for Hα. The x axis for V767 Cen differs from the other two to better see the features of this low inclination system.
Current usage metrics show cumulative count of Article Views (full-text article views including HTML views, PDF and ePub downloads, according to the available data) and Abstracts Views on Vision4Press platform.
Data correspond to usage on the plateform after 2015. The current usage metrics is available 48-96 hours after online publication and is updated daily on week days.
Initial download of the metrics may take a while.