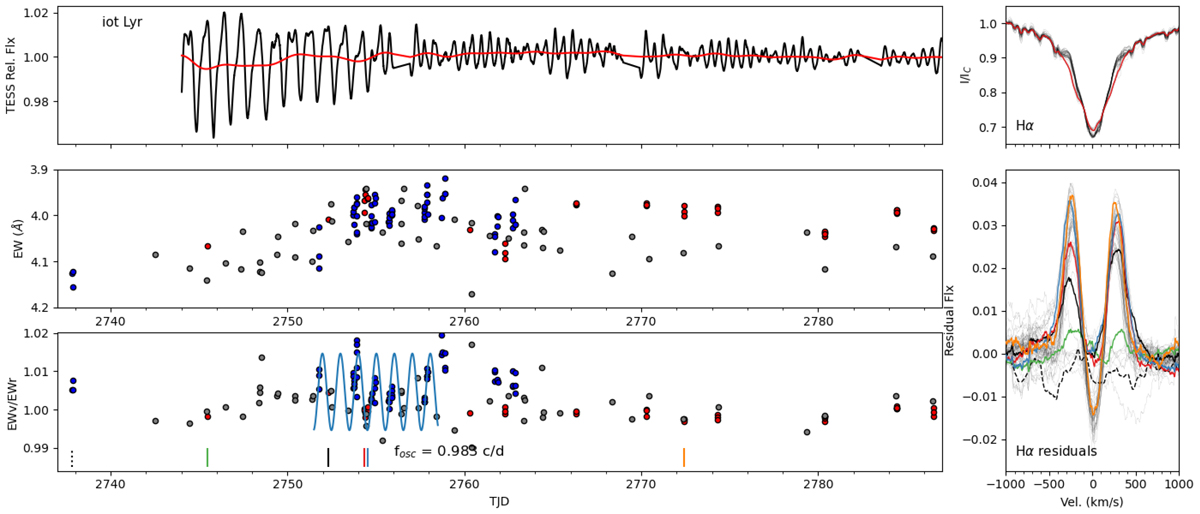
Fig B.4.
Download original image
Similar to Fig. 5, but for ι Lyr. Top-left panel: TESS light curve (black) with the low-frequency trends (<0.5 d−1) in red. Top-right panel: All NRES spectra (black curves), with the pre-outburst average profile in red. Bottom-right panel: NRES and DAO emission Hα profiles after subtracting off the pre-outburst average. Middle- and bottom-left panels: Hα EW and EWV/EWR, respectively with gray markers indicating amateur data, blue from DAO, and red from NRES. In the bottom-left panel, six vertical lines indicate epochs that are highlighted in the corresponding colors in the bottom-right panel. The dashed line is pre-outburst, and the green is the first professional spectrum after the start of the event.
Current usage metrics show cumulative count of Article Views (full-text article views including HTML views, PDF and ePub downloads, according to the available data) and Abstracts Views on Vision4Press platform.
Data correspond to usage on the plateform after 2015. The current usage metrics is available 48-96 hours after online publication and is updated daily on week days.
Initial download of the metrics may take a while.