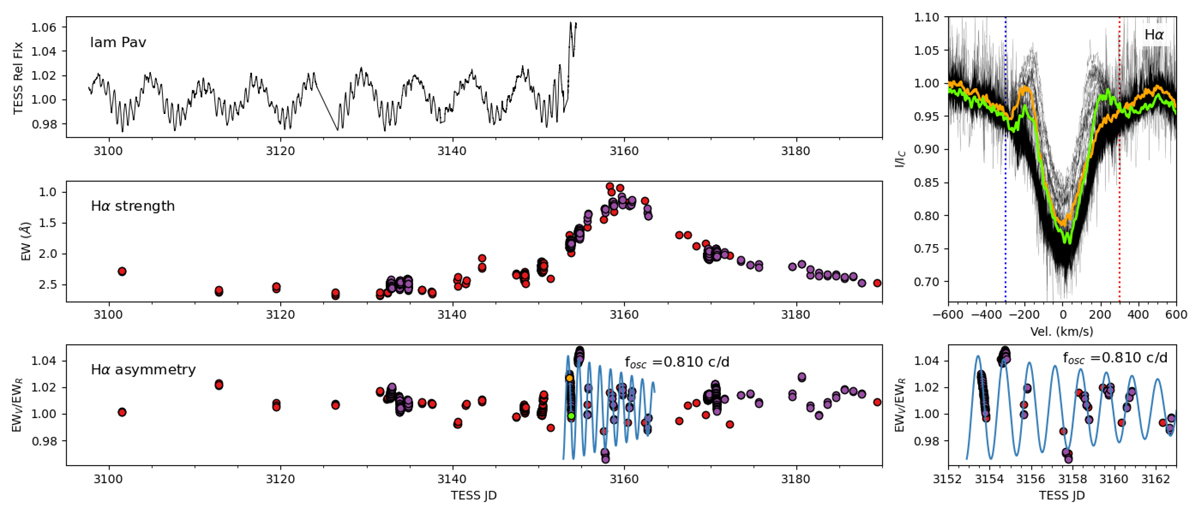
Fig B.3.
Download original image
TESS light curve and measurements of Hα observations of the Be star λ Pav, similar to Fig. 5. The red points are from NRES, and purple from the CHIRON spectrograph. Bottom-right panel: Zoom in on the Hα EWV/EWR values fit by Eq. 2. The orange and green dots correspond to the orange and green line profiles in the upper-right panel.
Current usage metrics show cumulative count of Article Views (full-text article views including HTML views, PDF and ePub downloads, according to the available data) and Abstracts Views on Vision4Press platform.
Data correspond to usage on the plateform after 2015. The current usage metrics is available 48-96 hours after online publication and is updated daily on week days.
Initial download of the metrics may take a while.