Fig B.1.
Download original image
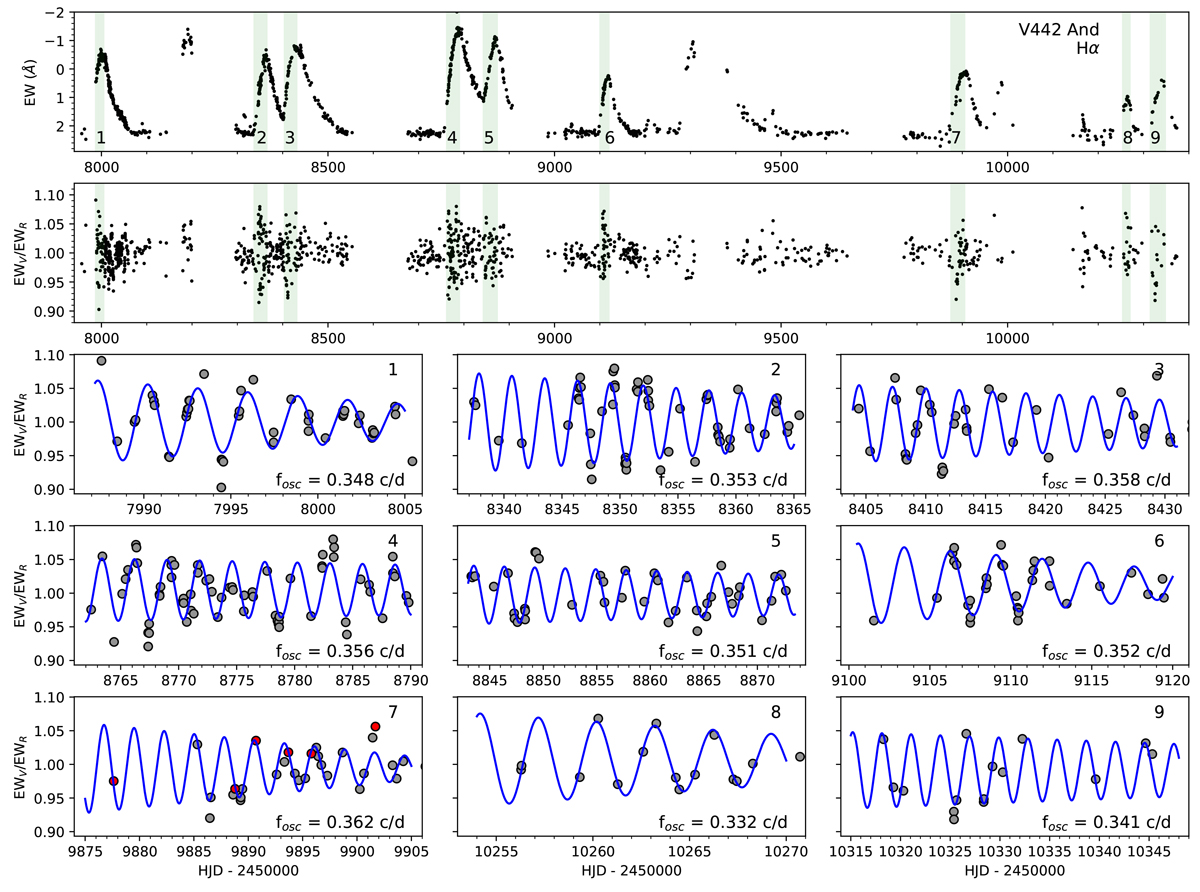
Measurements of Hα observations primarily from BeSS of the Be star V442 And. Top panel: EW. Second panel: EWV/EWR. Bottom panels: First many days of the outburst events 1 – 9 marked in the top panel with time coverage corresponding to the vertical shaded regions (NRES spectra plotted as red circles). The frequency of the EWV/EWR oscillations are given in the bottom-right corner of these panels.
Current usage metrics show cumulative count of Article Views (full-text article views including HTML views, PDF and ePub downloads, according to the available data) and Abstracts Views on Vision4Press platform.
Data correspond to usage on the plateform after 2015. The current usage metrics is available 48-96 hours after online publication and is updated daily on week days.
Initial download of the metrics may take a while.