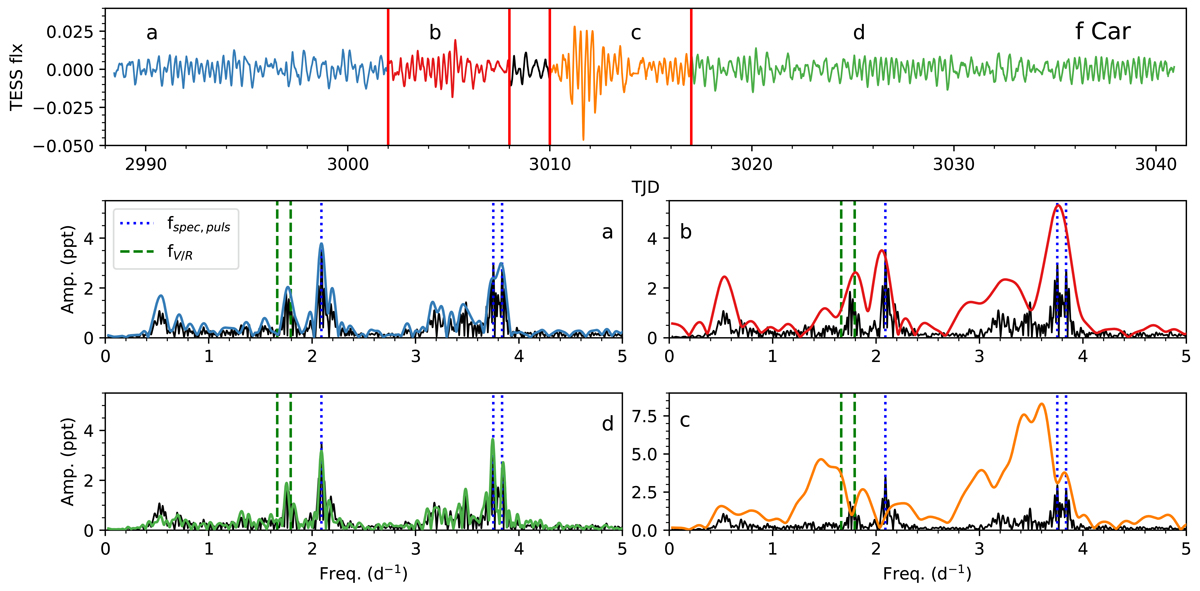
Fig. 12.
Download original image
Top panel: TESS light curve from Fig. 5 after subtracting out the low-frequency variations. It is split into four sections, labeled “a”, “b”, “c”, and “d”, corresponding to the pre-outburst disk-less phase (a), the first outburst (b), the second larger outburst (c), and the post-outburst phase (d). The corresponding frequency spectra from these sections are shown in the lower panels (in clockwise order), where the black curve is computed from sections a and d.
Current usage metrics show cumulative count of Article Views (full-text article views including HTML views, PDF and ePub downloads, according to the available data) and Abstracts Views on Vision4Press platform.
Data correspond to usage on the plateform after 2015. The current usage metrics is available 48-96 hours after online publication and is updated daily on week days.
Initial download of the metrics may take a while.