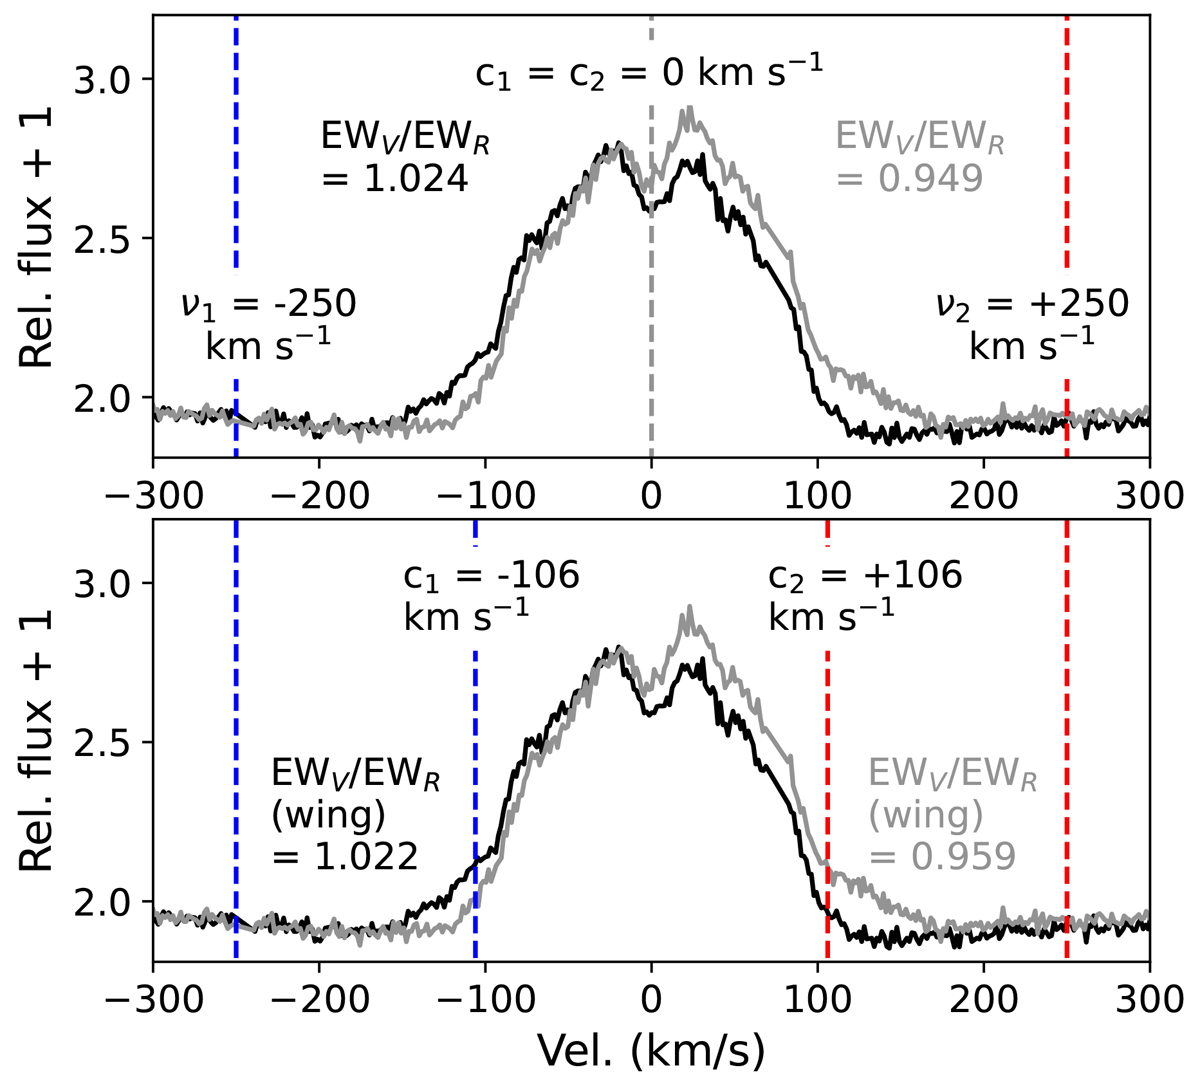
Fig. 1.
Download original image
Two Hα line profiles taken about 15 hours apart for one of our targets, V767 Cen, in black and gray (with corresponding EWV/EWR values printed) to illustrate the procedure for measuring EWV/EWR from Eq. (1). A constant, C = 1 is first added to the data. The outer integration limits are set at ∓250 km s−1 for ν1 and ν2. In the top panel, the inner integration limits, c1 and c2, are set at 0 km s−1 so that the full line profile is used. In the bottom panel, c1 and c2 are set at ∓v sin i (106 km s−1) so that only the wings are used in the calculation.
Current usage metrics show cumulative count of Article Views (full-text article views including HTML views, PDF and ePub downloads, according to the available data) and Abstracts Views on Vision4Press platform.
Data correspond to usage on the plateform after 2015. The current usage metrics is available 48-96 hours after online publication and is updated daily on week days.
Initial download of the metrics may take a while.