Fig. 7
Download original image
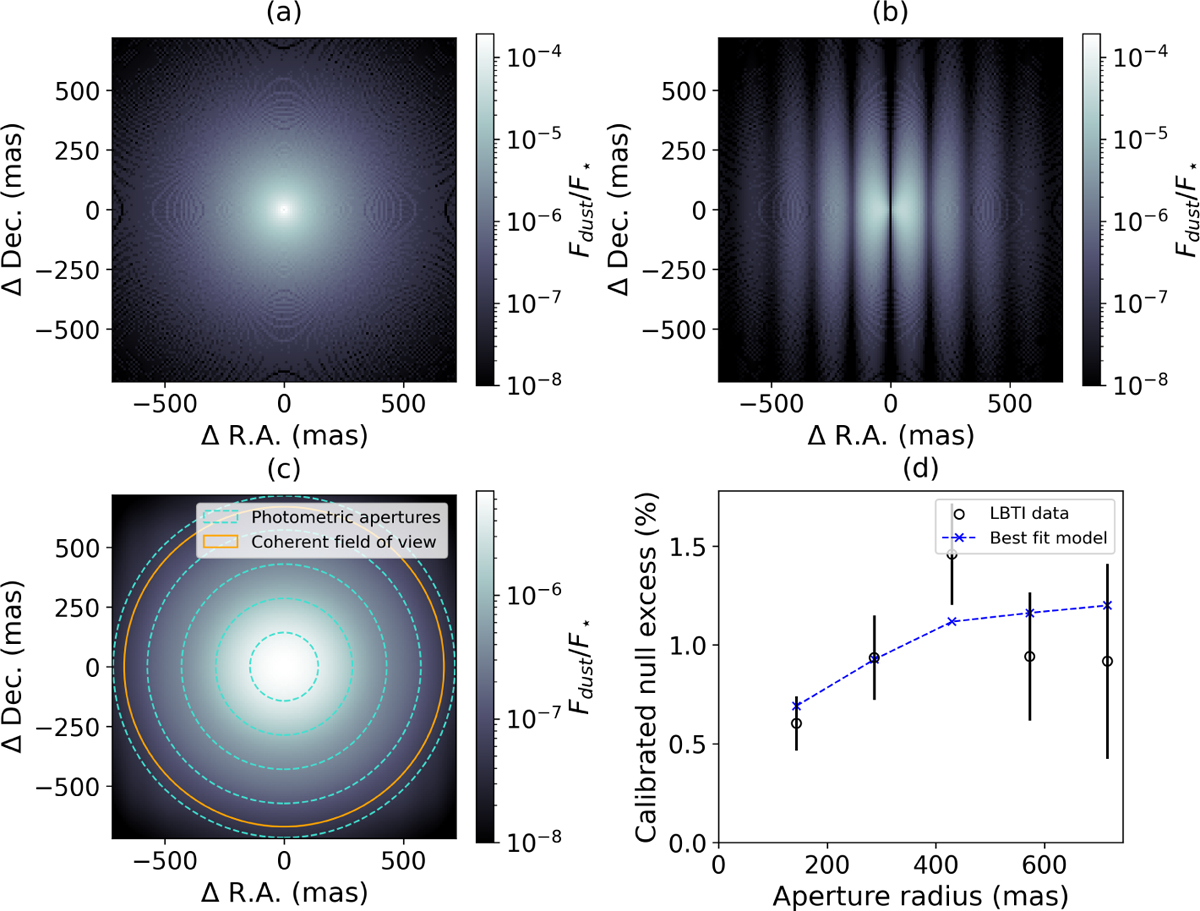
Results of the 2023 May 25 night modeling, showing the different steps of the procedure. The geometry used is a disk with Σ0 = 3 × 10⁵ and α = 0, the orientation is face-on. From (a) to (d) show: the angular distribution of Fdust/F★, the impact of the LBTI transmission map, the convolution with the PSF of the LBT, and the comparison between the observed excess and the modeled excess. Panel (c) indicates the photometric apertures used in the reduction with the dashed circles. The coherent FOV is indicated with the solid orange circle. The maps have a pixel size of 10 mas.
Current usage metrics show cumulative count of Article Views (full-text article views including HTML views, PDF and ePub downloads, according to the available data) and Abstracts Views on Vision4Press platform.
Data correspond to usage on the plateform after 2015. The current usage metrics is available 48-96 hours after online publication and is updated daily on week days.
Initial download of the metrics may take a while.