Fig. 3
Download original image
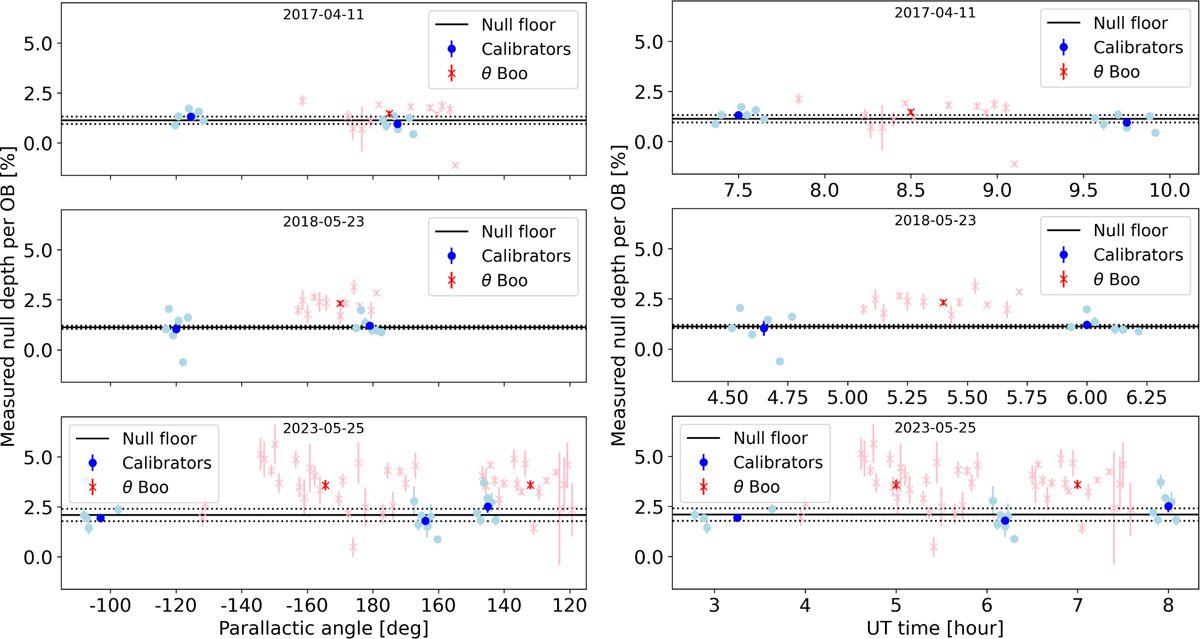
Null depths obtained after the data reduction pipeline described in Sect. 3.1. These points are computed using the reduction pipeline with an aperture radius of 24 pixels (i.e., 430 mas). The OBs are plotted as a function of their parallactic angle (left) and UT of observation (right), for each of the three nights: 2017 April 11 (top), 2018 May 23 (middle), and 2023 May 25 (bottom). In each panel, light blue points and light red crosses show the measured null depth of the OBs for the calibrators and for θ Boo, respectively. Dark blue points and dark red crosses indicate the null depth values for each pointing, corresponding to the unweighted mean values of the OBs included in the pointing. The instrumental null depths measured from the calibrators are averaged to calculate the null floor, which represents the reference level below which any excess cannot be reliably detected. The null floor and its error bar are shown by the solid and dotted black lines, respectively. The error bar corresponds to the 1σ standard deviation.
Current usage metrics show cumulative count of Article Views (full-text article views including HTML views, PDF and ePub downloads, according to the available data) and Abstracts Views on Vision4Press platform.
Data correspond to usage on the plateform after 2015. The current usage metrics is available 48-96 hours after online publication and is updated daily on week days.
Initial download of the metrics may take a while.