Open Access
Fig. B.1
Download original image
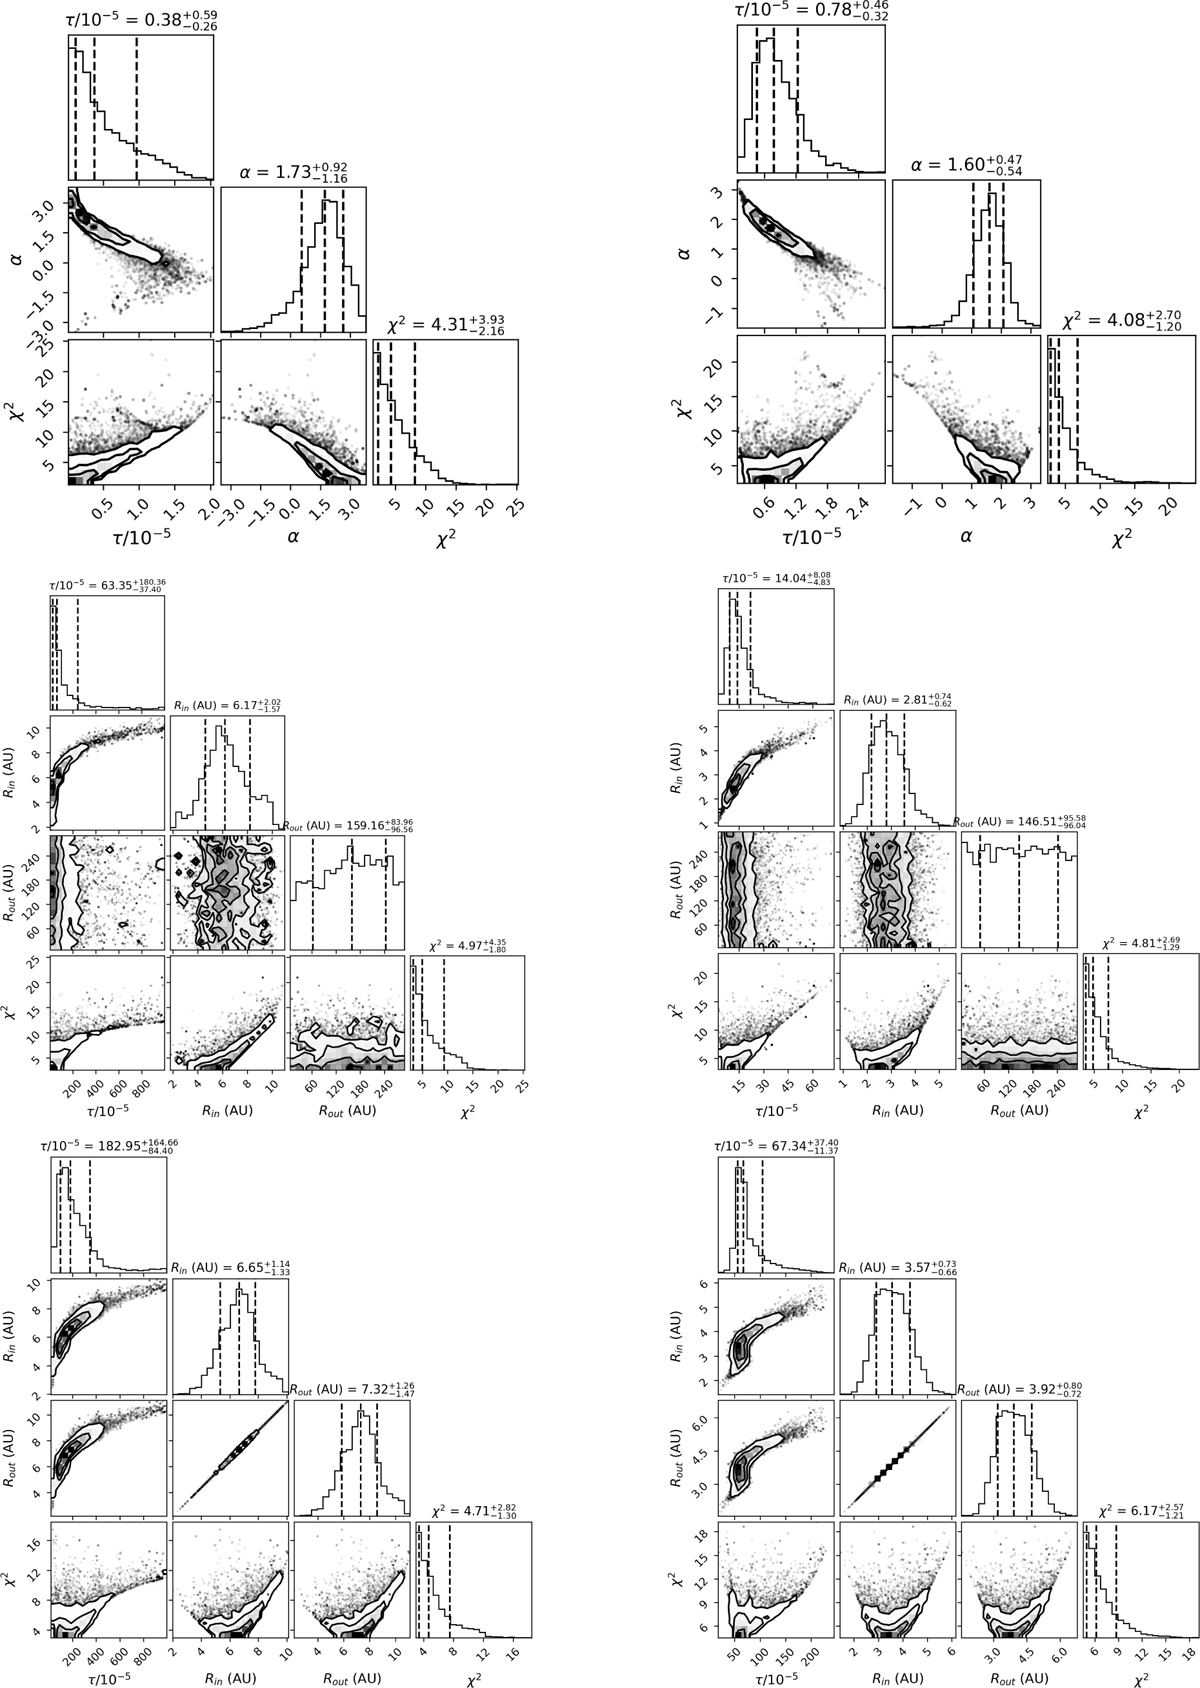
Corner plots showing the MCMC posteriors for the model fitting of the 2017 (left) and 2018 (right) datasets. The posteriors are given for a “disk” (top), “wide ring” (middle), and “thin ring” (bottom) geometry.
Current usage metrics show cumulative count of Article Views (full-text article views including HTML views, PDF and ePub downloads, according to the available data) and Abstracts Views on Vision4Press platform.
Data correspond to usage on the plateform after 2015. The current usage metrics is available 48-96 hours after online publication and is updated daily on week days.
Initial download of the metrics may take a while.