Fig. 14
Download original image
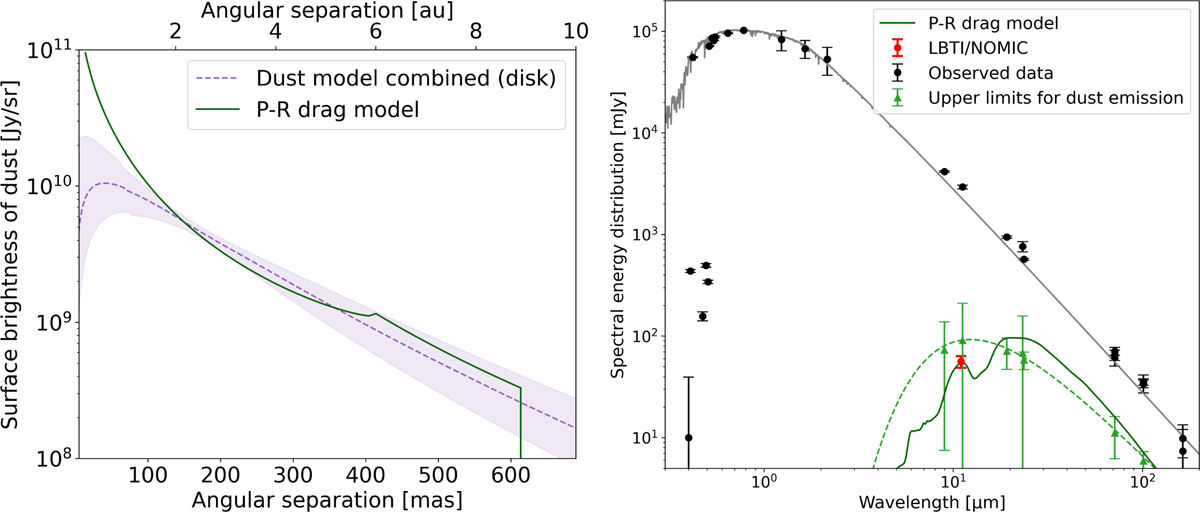
Left: radial distribution of the dust surface brightness models for the combined 2017, 2018 and 2023 dataset. Models are calculated at a wavelength of 11 μm, with 1σ error bars derived from the MCMC posteriors. The solid line represents the predicted surface brightness from the P-R drag model for an outer belt extending from 6 au to 9 au, with a mass of 7 × 10⁻⁶ M⊕. The dust composition is considered to be 1/3 silicate and 2/3 carbon. Right: SED of the dust from the P-R drag model.
Current usage metrics show cumulative count of Article Views (full-text article views including HTML views, PDF and ePub downloads, according to the available data) and Abstracts Views on Vision4Press platform.
Data correspond to usage on the plateform after 2015. The current usage metrics is available 48-96 hours after online publication and is updated daily on week days.
Initial download of the metrics may take a while.