Fig. 9.
Download original image
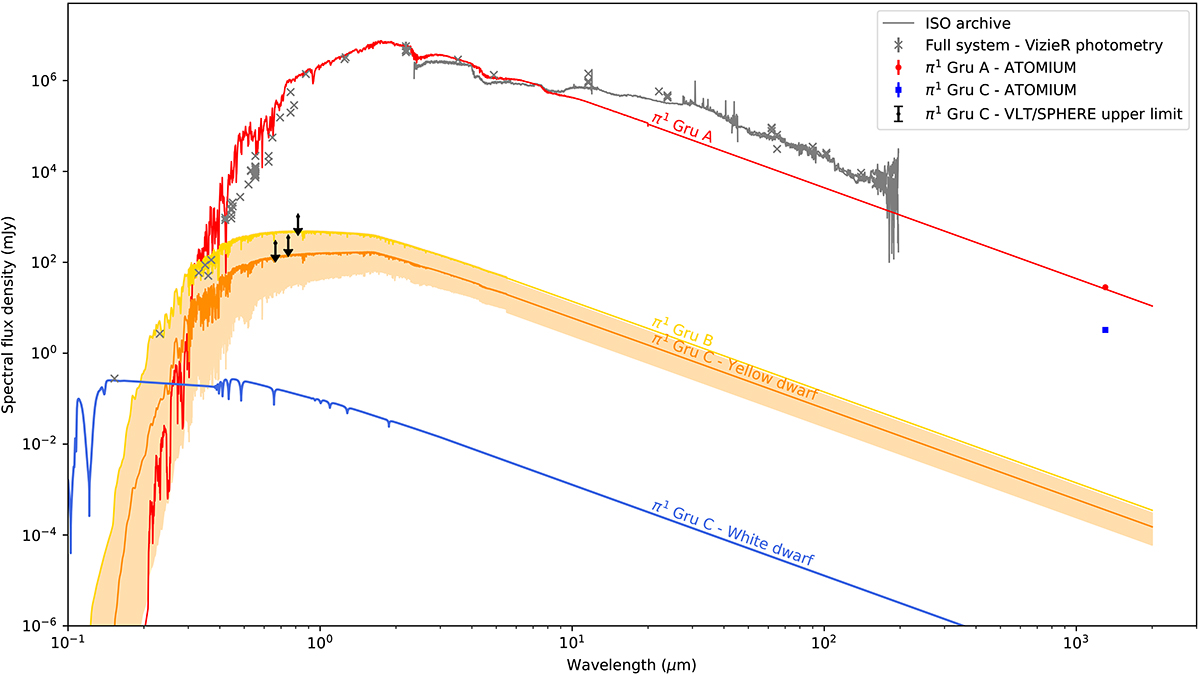
Photometry and spectral energy distributions (SEDs) for the π1 Gru system. Interstellar or circumstellar reddening are neglected. The gray crosses are VizieR ultraviolet to mid-infrared photometry of the full system. The gray continuous line shows the ISO spectra. Black arrows indicate VLT/SPHERE-ZIMPOL upper detection limits of the C companion (68% confidence). The red dot and blue square denote the integrated spectral flux density from the ALMA Band 6 continuum map for the primary and the C companion, respectively. The red curve represents a MARCS S-type SED for a star similar to π1 Gru A without circumstellar dust. The yellow and orange curves correspond to PHOENIX SEDs for a G0V (B companion), and a K1V (C companion) MS star, respectively. The orange shading shows the uncertainty on the C companion properties under the MS star scenario. The blue curve corresponds to the WD scenario for the inner companion. For more details see Sect. 3.5.
Current usage metrics show cumulative count of Article Views (full-text article views including HTML views, PDF and ePub downloads, according to the available data) and Abstracts Views on Vision4Press platform.
Data correspond to usage on the plateform after 2015. The current usage metrics is available 48-96 hours after online publication and is updated daily on week days.
Initial download of the metrics may take a while.