Fig. 6.
Download original image
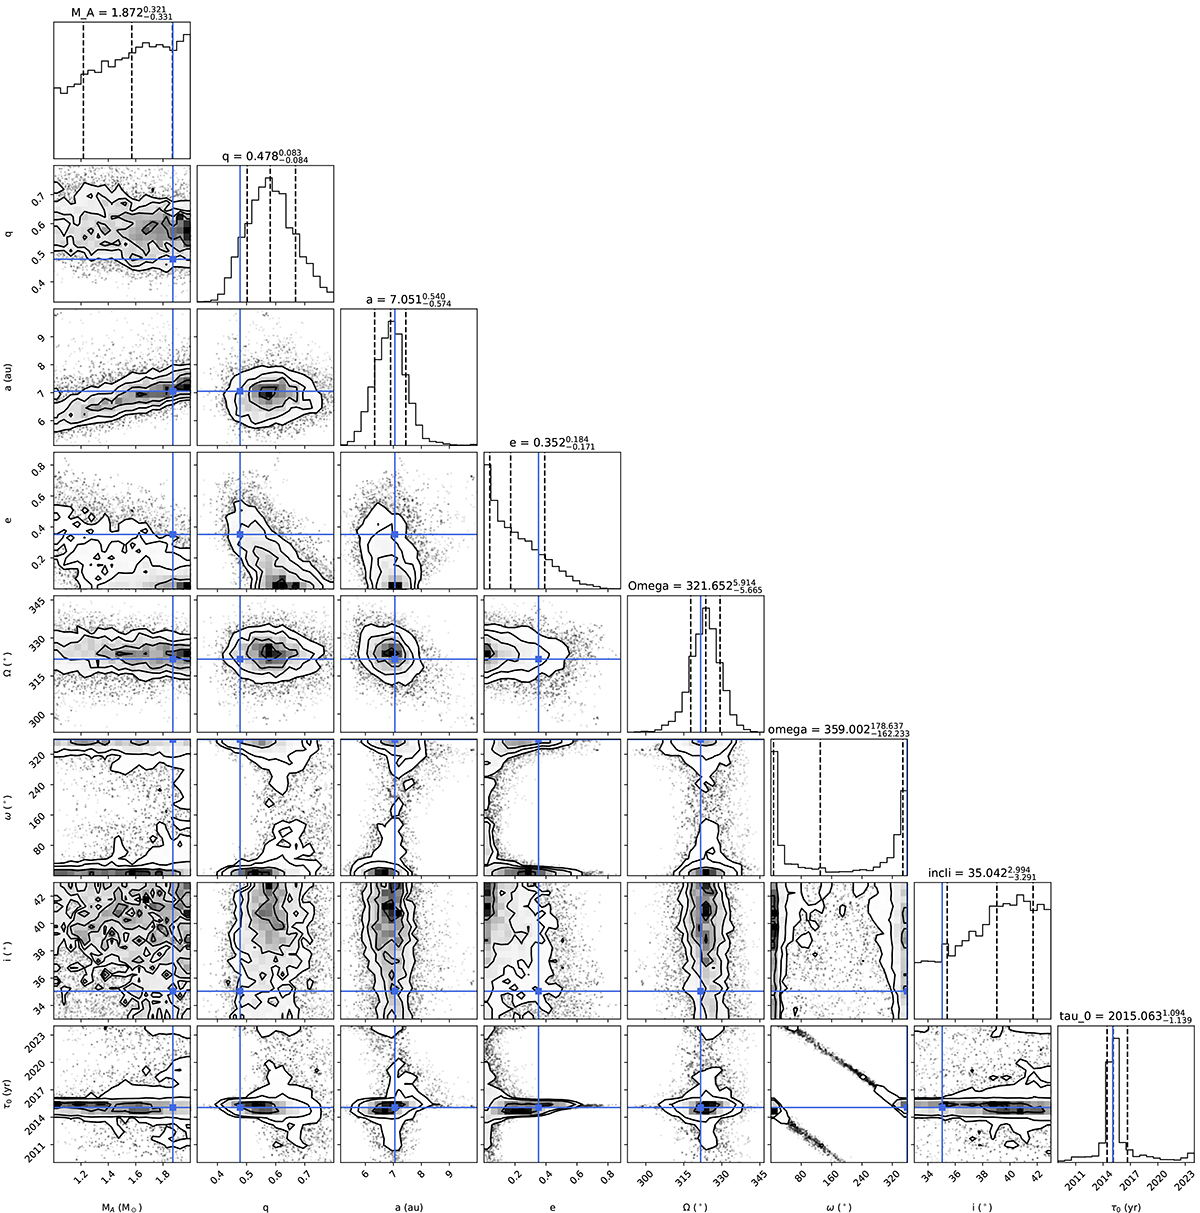
Corner plot of the UltraNest run posterior probability distributions for the eight orbital parameters: MA the mass of the AGB star in M⊙, q the mass ratio, a the semi-major axis in au, e the eccentricity, Ω the longitude of the ascending node in degrees, ω the longitude of the periastron in degrees, i the inclination in degrees, and τ0 the periastron epoch. For the diagonal distributions, the central vertical dashed line indicates the mean value of the probability distribution, while the left and right vertical dashed lines correspond to the 68.3% credible probability level. Blue lines indicate the maximum likelihood parameters. Contours show the 68.3%, 39.3% posterior and 68.3% marginal posterior distributions. For Ω and ω, the full range of angles is explored, and the horizontal axis is wrapped.
Current usage metrics show cumulative count of Article Views (full-text article views including HTML views, PDF and ePub downloads, according to the available data) and Abstracts Views on Vision4Press platform.
Data correspond to usage on the plateform after 2015. The current usage metrics is available 48-96 hours after online publication and is updated daily on week days.
Initial download of the metrics may take a while.