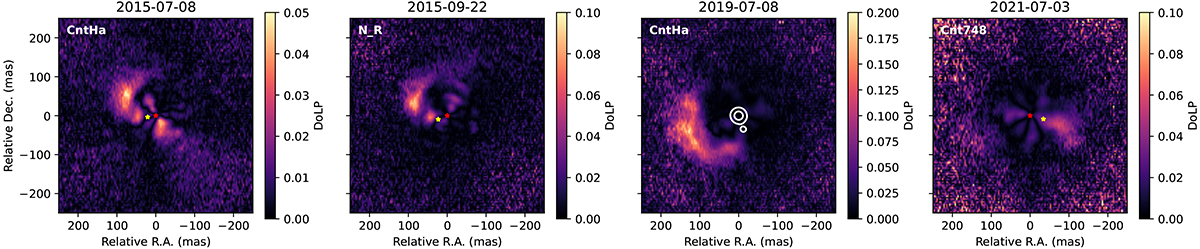
Fig. 2.
Download original image
Degree of linear polarization in the visible measured with ZIMPOL. North is up, and east is to the left. The epoch is indicated above each image. The filter for each epoch is indicated in the top left corner of each image and was chosen to show the most prominent feature. Red stars indicate the position of the AGB star from the intensity frame and yellow stars indicate the C companion expected position at the epoch of the corresponding ZIMPOL observation, derived from the best orbit fit of Sect. 3.2.3. For the 2019 epoch, the 2 and 10 mJy/beam contours of the ALMA continuum image (Fig. 1) replace these symbols. Images in all filters for each epoch are shown on Fig. B.1.
Current usage metrics show cumulative count of Article Views (full-text article views including HTML views, PDF and ePub downloads, according to the available data) and Abstracts Views on Vision4Press platform.
Data correspond to usage on the plateform after 2015. The current usage metrics is available 48-96 hours after online publication and is updated daily on week days.
Initial download of the metrics may take a while.