Fig. 11
Download original image
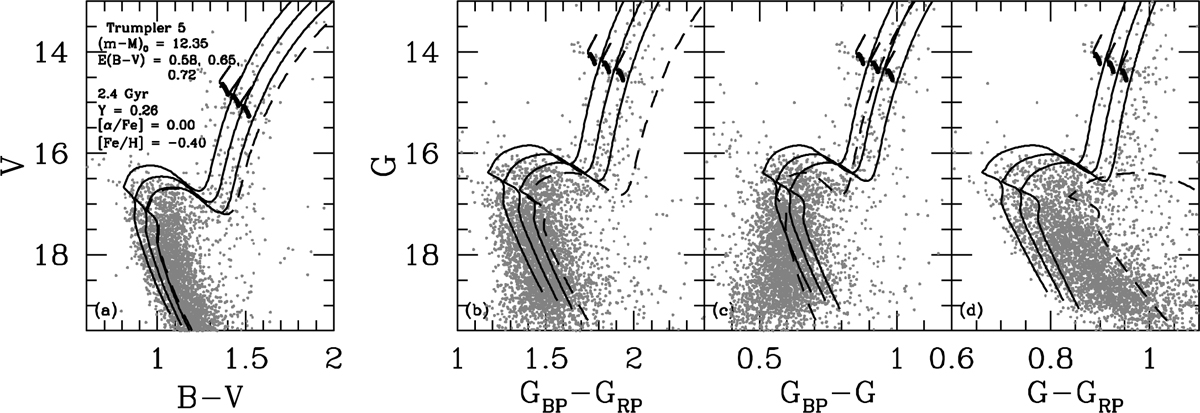
Superposition onto the observed Trumpler 5 CMDs of isochrones for the indicated age and chemical abundances, and for E(B-V) values ranging from 0.58 to 0.72 (in the direction from left to right). The dashed loci are identical to the dashed isochrones for E(B − V) = 0.72 in the respective panels of Fig. 10. The heavy solid curves indicate the location of ZAHB models with masses ranging from 1.0 ℳ⊙ to 1.46 ℳ⊙ in the direction of increasing brightness. The evolutionary track for most of the core He-burning phase of the 1.46 ℳ⊙ ZAHB model is shown as a thin solid curve originating at the bright end of the ZAHB.
Current usage metrics show cumulative count of Article Views (full-text article views including HTML views, PDF and ePub downloads, according to the available data) and Abstracts Views on Vision4Press platform.
Data correspond to usage on the plateform after 2015. The current usage metrics is available 48-96 hours after online publication and is updated daily on week days.
Initial download of the metrics may take a while.