Open Access
Fig. 1
Download original image
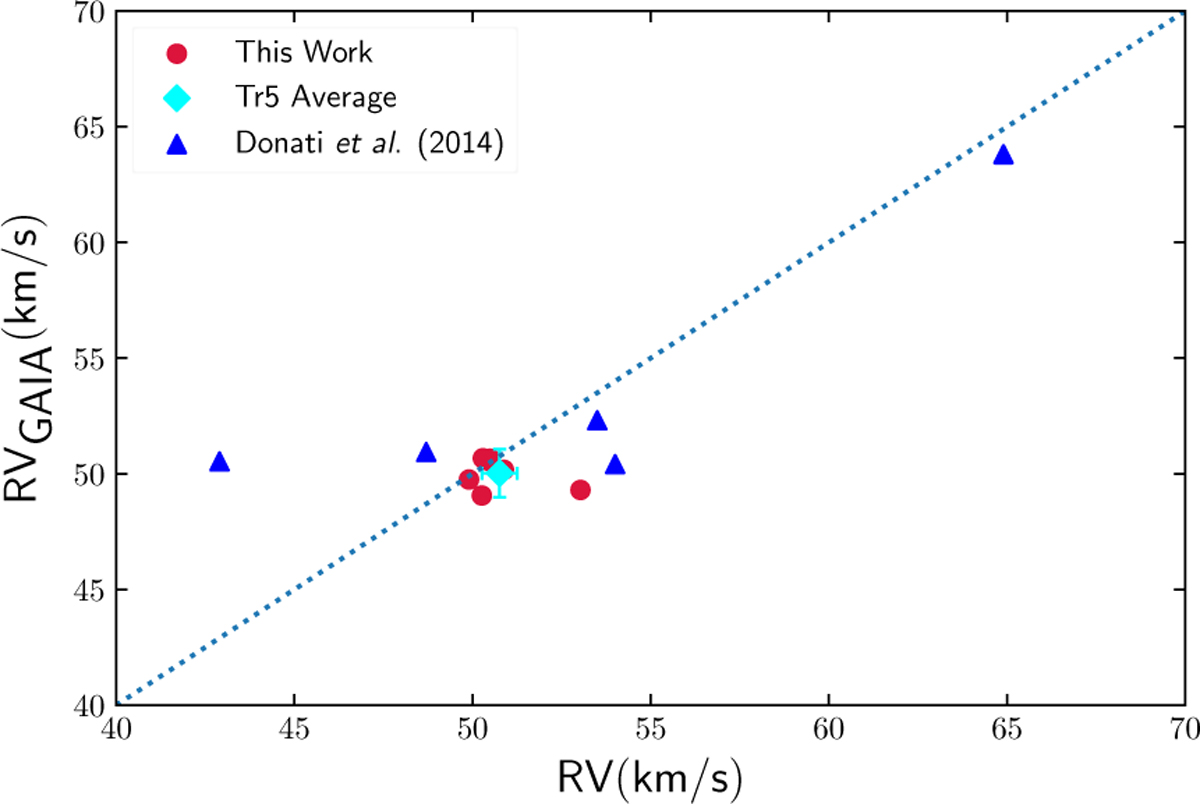
Comparison between the radial velocities from Gaia DR3 (RVGaia) and the radial velocities measured from IGRINS spectra (RVIGRINS) and the velocities taken from the literature. The blue diamond shows the average velocity of our target stars and the dotted red line shows the equality of RVGaia and RVIGRINS velocities.
Current usage metrics show cumulative count of Article Views (full-text article views including HTML views, PDF and ePub downloads, according to the available data) and Abstracts Views on Vision4Press platform.
Data correspond to usage on the plateform after 2015. The current usage metrics is available 48-96 hours after online publication and is updated daily on week days.
Initial download of the metrics may take a while.