Fig. 5
Download original image
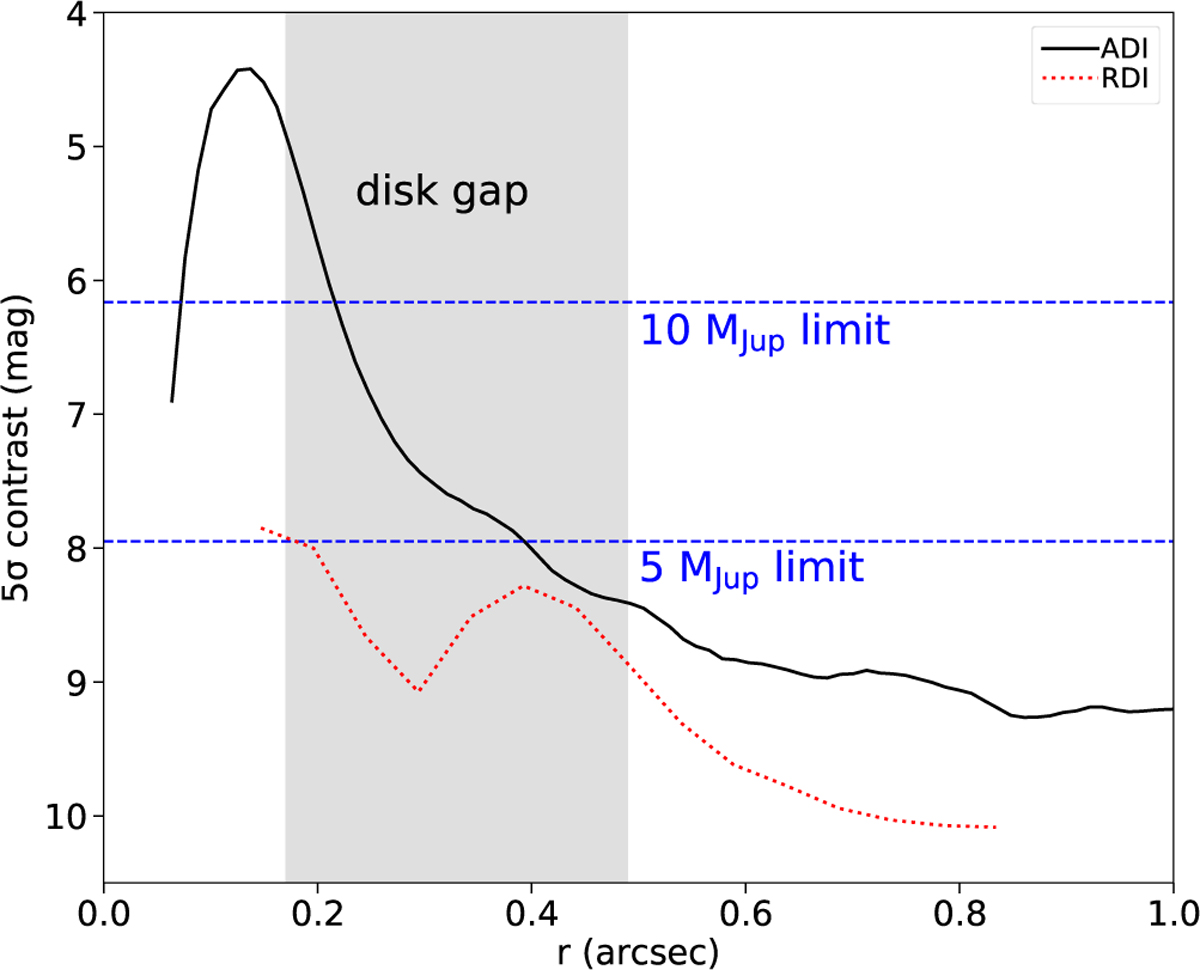
SPHERE K-band detection limits as function of radial separation from the central star. We indicate the approximate position of the radial gap in the disk by the gray shaded area. The solid black line gives the detection limit via fake planet injection for the ADI reduction of the K-band data. The dotted red line gives the RDI detection limit by measuring the noise in the final iterative RDI image in concentric circles and scaling the stellar signal to a signal-to-noise ratio of 5. We show corresponding mass limits via the dashed blue lines and based on AMES-DUSTY evolutionary models.
Current usage metrics show cumulative count of Article Views (full-text article views including HTML views, PDF and ePub downloads, according to the available data) and Abstracts Views on Vision4Press platform.
Data correspond to usage on the plateform after 2015. The current usage metrics is available 48-96 hours after online publication and is updated daily on week days.
Initial download of the metrics may take a while.