Fig. 4
Download original image
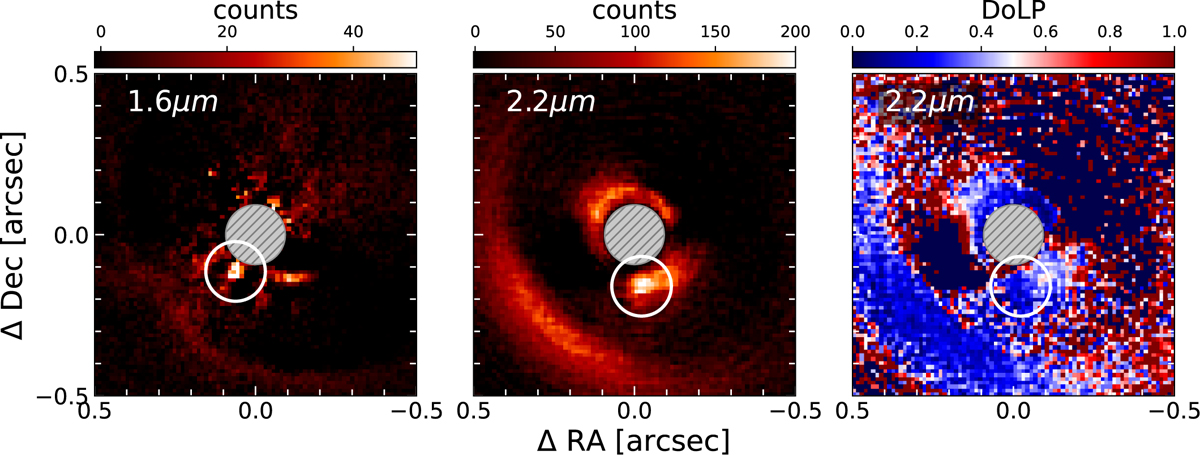
Total-intensity images of 2MASS1612 system; same as in Figure 2, but with a zoomed-in view of the tentative point-source detections, which are marked by a white circle. The right panel shows the degree of linear polarization for the K-band data as derived from the iRDI and polarized-intensity image. The tentative point-source location is marked and shows a lower dip than the directly adjacent inner-disk signal.
Current usage metrics show cumulative count of Article Views (full-text article views including HTML views, PDF and ePub downloads, according to the available data) and Abstracts Views on Vision4Press platform.
Data correspond to usage on the plateform after 2015. The current usage metrics is available 48-96 hours after online publication and is updated daily on week days.
Initial download of the metrics may take a while.