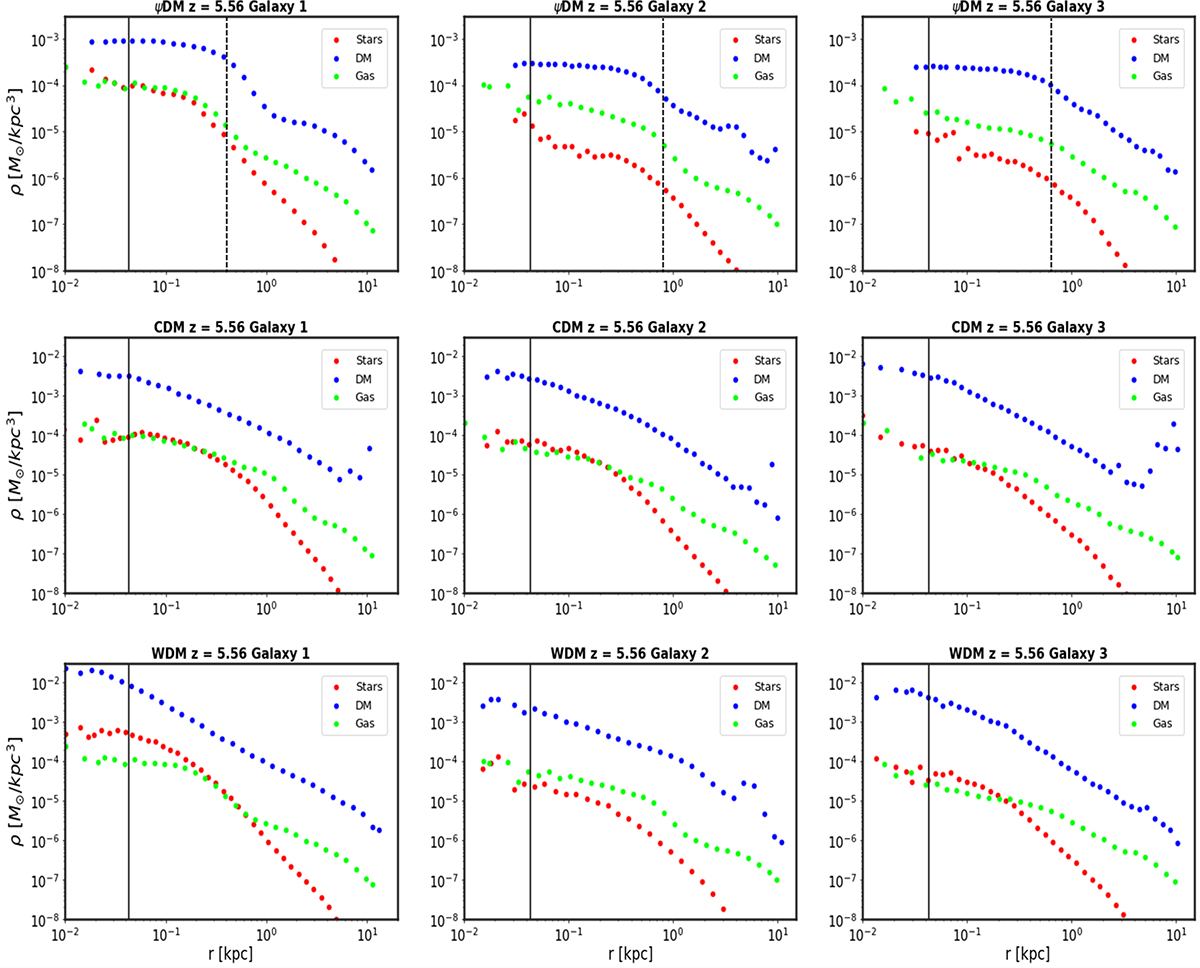
Fig. 5.
Download original image
Representation of the stellar, dark matter, and gaseous profiles for three Galaxies from different DM scenarios: ψDM, “WDM”, and CDM. The core-halo structure is visible for all three ψDM dark matter profiles with a clear transition point dividing both regimes, while CDM and “WDM” exhibit the expected cuspy shapes. This difference is also visible in stellar profiles between different DM models, with bigger flat cores and more prominent falls in the ψDM cases compared to the more smoothed shapes of “WDM”–CDM. For ψDM G1, the stellar and gaseous profiles display a similar core radius as well as transition points compared to the DM profile. The vertical dashed black line represents the core radius of the respective solitons. The vertical solid black line represents the comoving resolution limit of the data, indicating that values smaller than this limit should be treated with caution due to their potentially unreliable nature. This is why we did not take them into account for the fitting.
Current usage metrics show cumulative count of Article Views (full-text article views including HTML views, PDF and ePub downloads, according to the available data) and Abstracts Views on Vision4Press platform.
Data correspond to usage on the plateform after 2015. The current usage metrics is available 48-96 hours after online publication and is updated daily on week days.
Initial download of the metrics may take a while.