Open Access
Fig. A.1.
Download original image
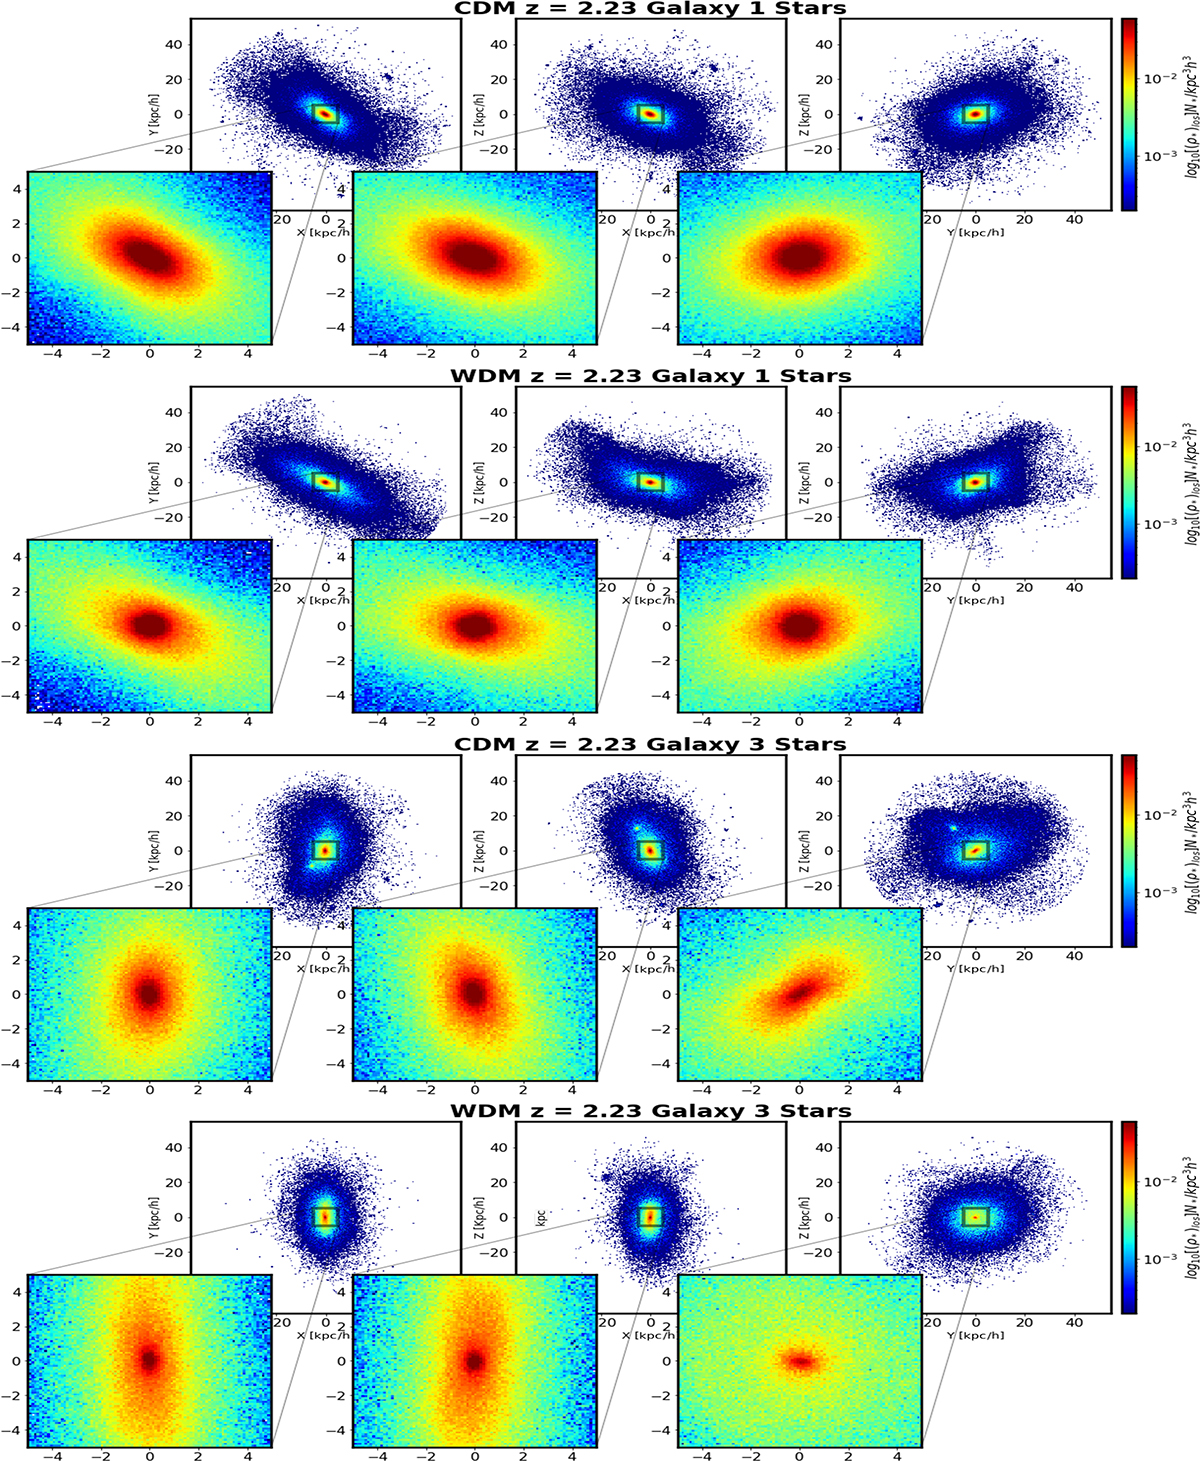
Logarithm of the projected number density of stellar particles in each simulated galaxy. The row headers indicate the halo number, the DM model, and the redshift. Additionally, we zoom in on the central regions of the galaxies for a closer view. The data is represented in comoving units.
Current usage metrics show cumulative count of Article Views (full-text article views including HTML views, PDF and ePub downloads, according to the available data) and Abstracts Views on Vision4Press platform.
Data correspond to usage on the plateform after 2015. The current usage metrics is available 48-96 hours after online publication and is updated daily on week days.
Initial download of the metrics may take a while.