Fig. 5
Download original image
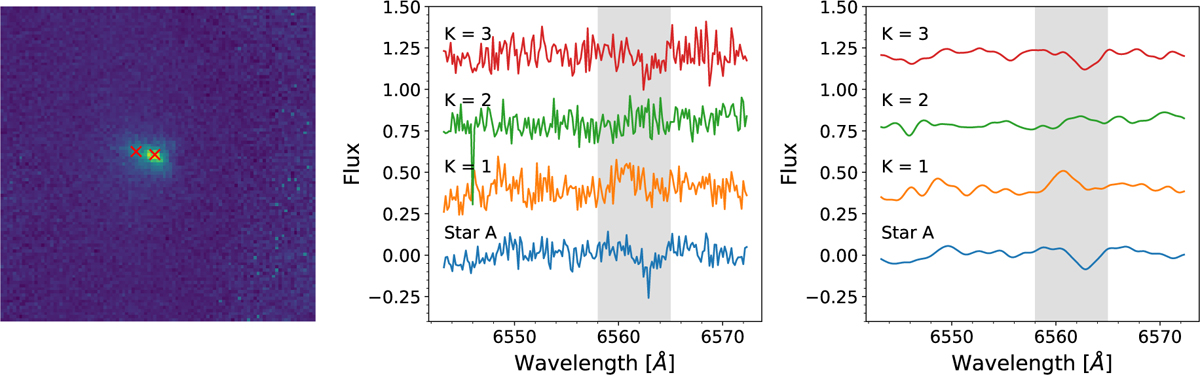
MagAO-X/IFU data of the binary. Left panel: IFU images of the binary stacked along the wavelength channel. The image is not rotated to place North up. Middle panel: spectrum of star A and the first three principal components of star B’s spectra. The grey area shows the Hα line band. Star A presents Hα absorption. The first component presents Hα emission from star B. The third component (K=3) is the contamination from star A. Right panel: smoothed version of the middle panel by a Gaussian kernel with a standard deviation of 0.48 Å. The grey area shows the Hα line band.
Current usage metrics show cumulative count of Article Views (full-text article views including HTML views, PDF and ePub downloads, according to the available data) and Abstracts Views on Vision4Press platform.
Data correspond to usage on the plateform after 2015. The current usage metrics is available 48-96 hours after online publication and is updated daily on week days.
Initial download of the metrics may take a while.