Fig. C.1
Download original image
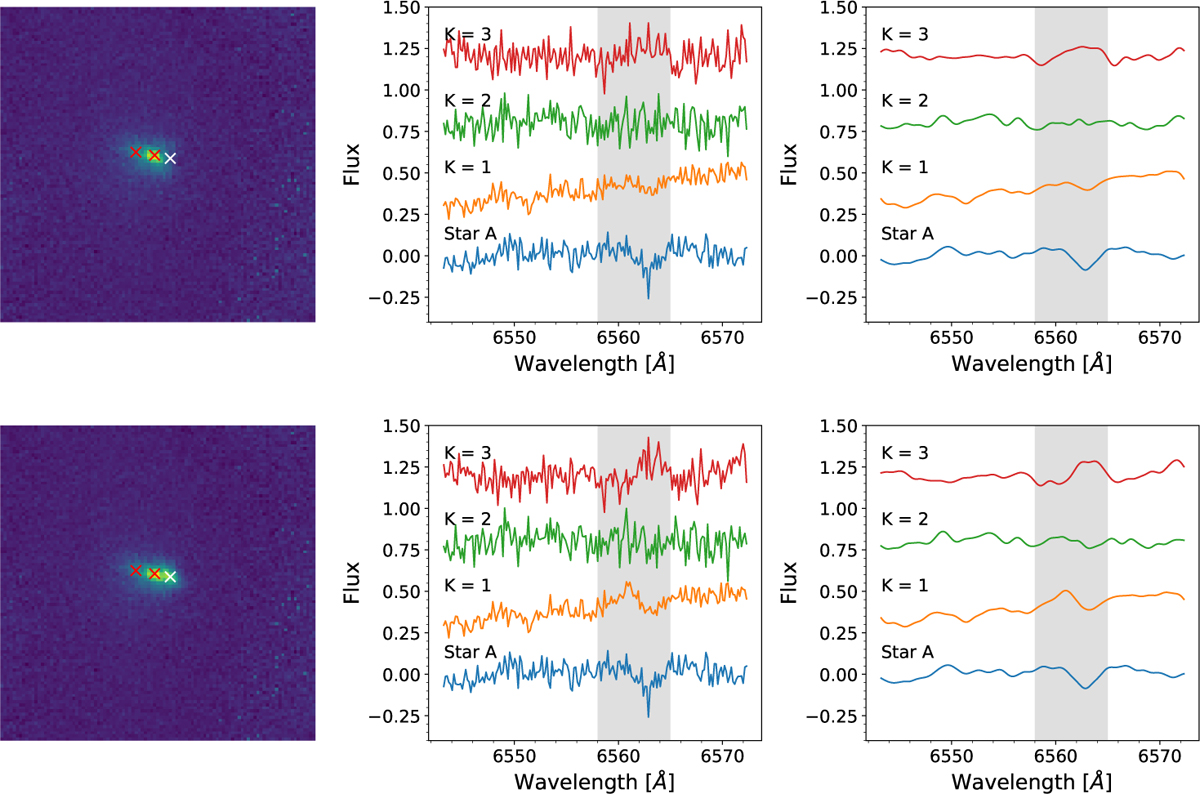
Injection test for radial velocity measurements in VIS-X IFU data. Upper panel: Original data. Bottom panel: Fake Gaussian signal of the same contrast and same blue shift as the fainter star injected at the same separation but in the opposite direction, shown by the cross marker in white. Before the injection, there is no signal in the first component (K=1) in the upper panel. After the injection, we detected the emission at the supposed blue shift and amplitude in the first component (K=1) in the lower panel.
Current usage metrics show cumulative count of Article Views (full-text article views including HTML views, PDF and ePub downloads, according to the available data) and Abstracts Views on Vision4Press platform.
Data correspond to usage on the plateform after 2015. The current usage metrics is available 48-96 hours after online publication and is updated daily on week days.
Initial download of the metrics may take a while.