Fig. 7.
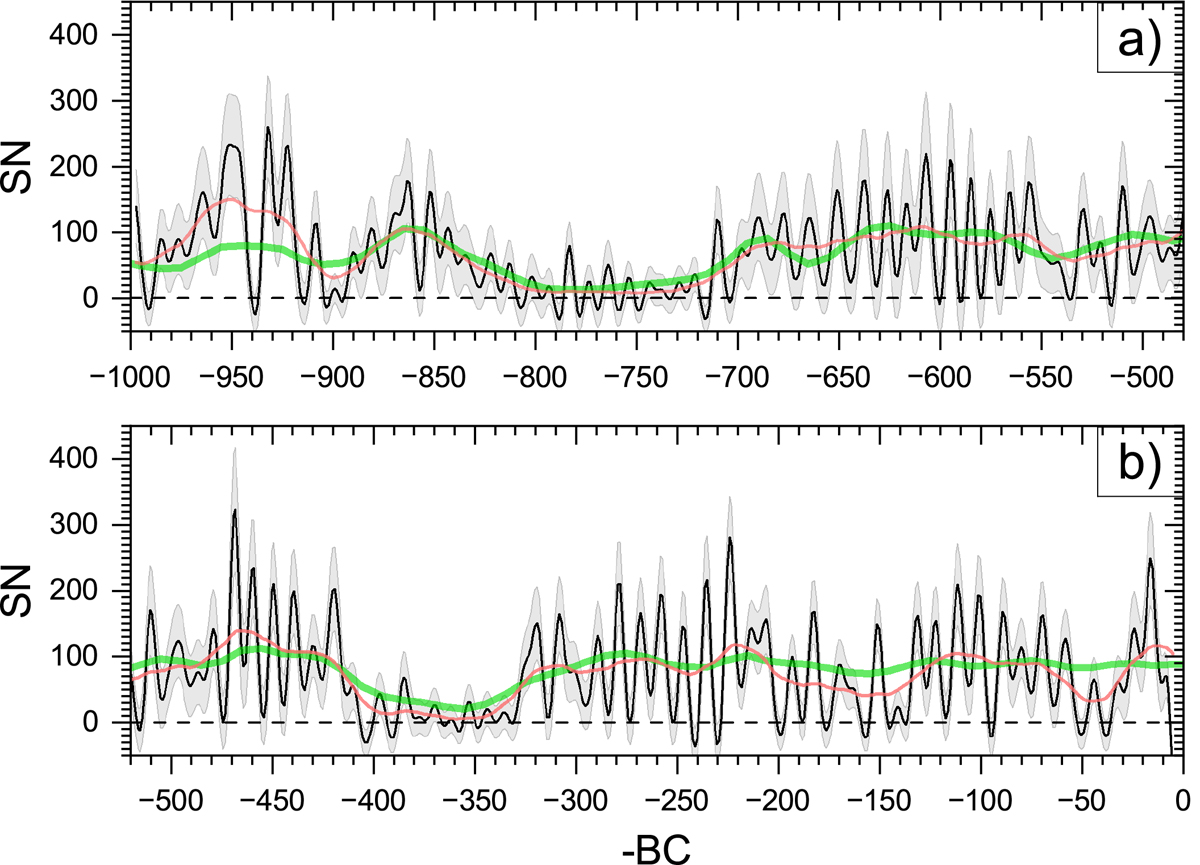
Download original image
Reconstructed sunspot numbers for 997–7 BC, shown in two panels for better visibility. The black curve, grey shaded area, and red curve depict the mean annual reconstructed SN, its 1σ (68%) confidence interval, and the 22-year smoothed evolution (see main text), respectively. These data are identical to those in Figure 2d. The green curve depicts the decadal SN values reconstructed from multi-proxy cosmogenic isotope data by Wu et al. (2018b) reduced to the ISN-v2 normalisation. The horizontal dashed line marks the SN = 0 line.
Current usage metrics show cumulative count of Article Views (full-text article views including HTML views, PDF and ePub downloads, according to the available data) and Abstracts Views on Vision4Press platform.
Data correspond to usage on the plateform after 2015. The current usage metrics is available 48-96 hours after online publication and is updated daily on week days.
Initial download of the metrics may take a while.