Fig. 4.
Download original image
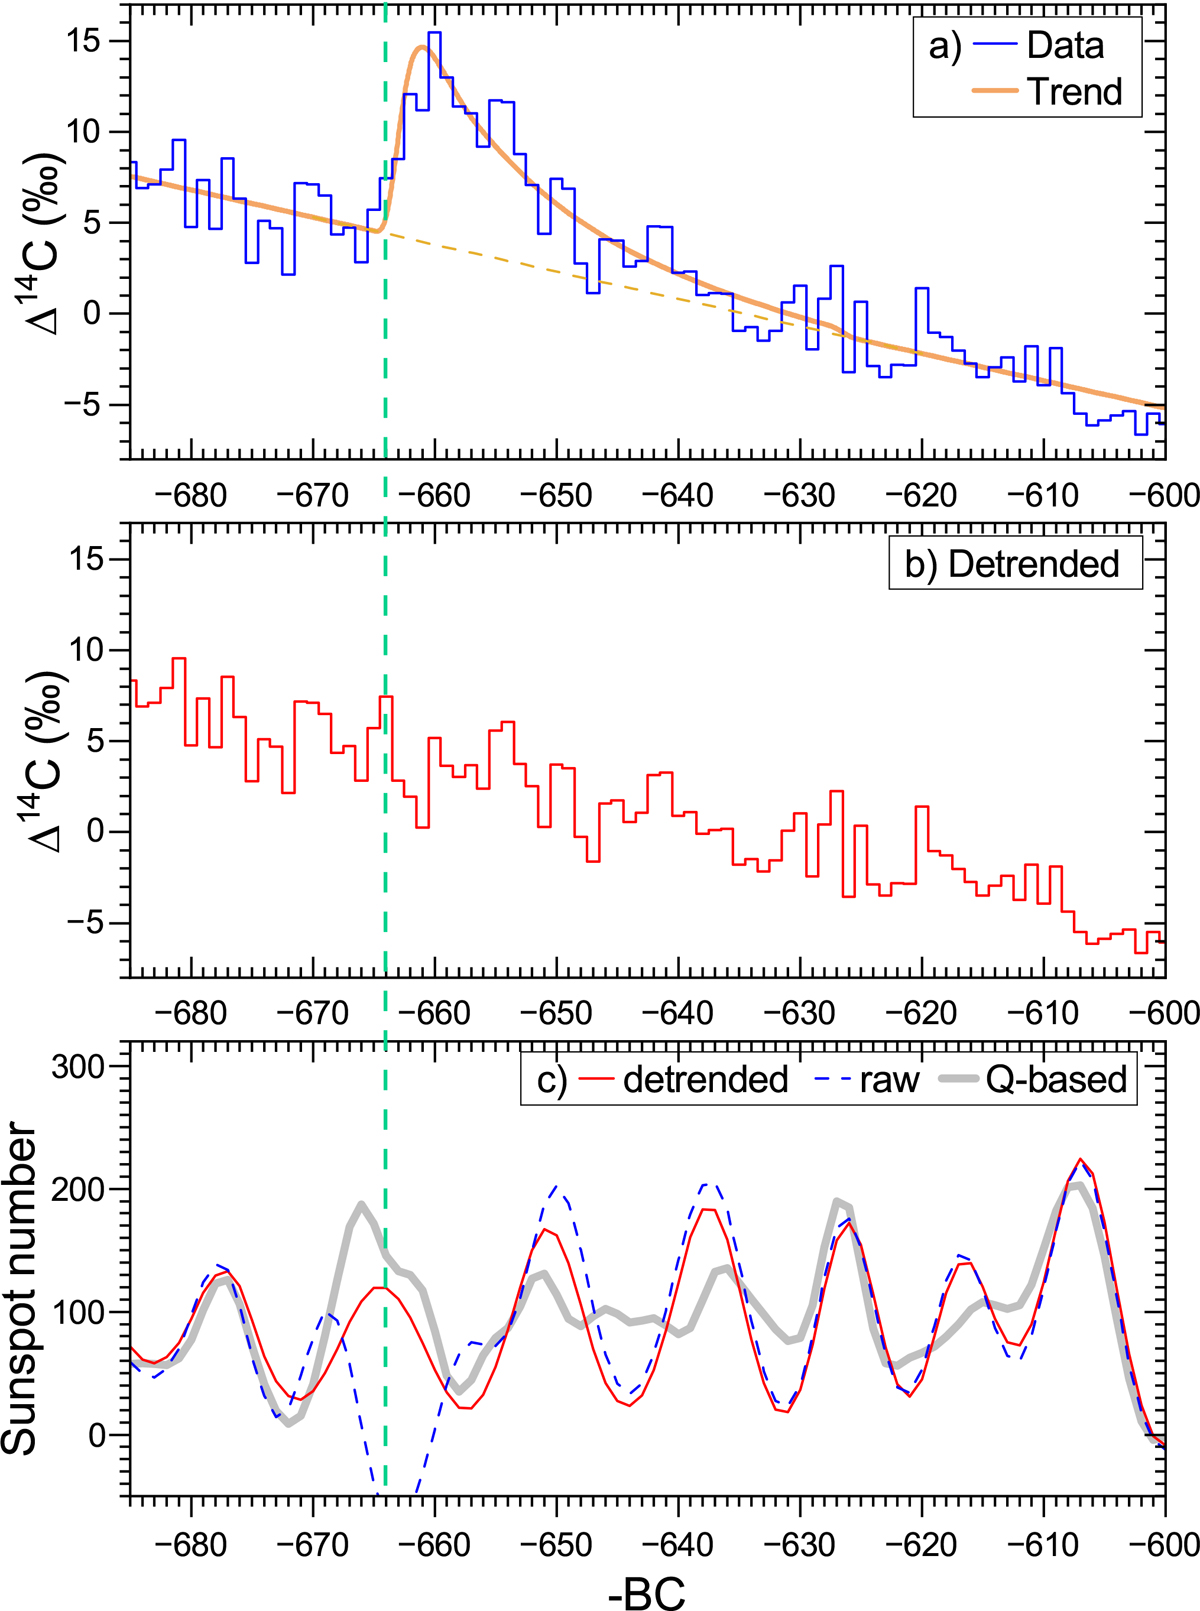
Correction for the ESPE of 664 BC. Panel a: Raw annual Δ14C data (blue curve) for the period 685–600 BC (Brehm et al. 2025) along with the ESPE-modelled time profile (red curve; see Sect. 3.2) superimposed onto a linear trend caused by the slow relaxation of the 14C atmospheric concentration after the previous grand minimum (dotted orange line). Panel b: Detrended Δ14C data after the removal of the ESPE profile. Panel c: Reconstructed SN based on the raw (dotted blue curve) and detrended (red curve) Δ14C data, along with the SN based on the 14C production rate Q from Brehm et al. (2025). The vertical dashed green line denotes 664 BC when the ESPE took place.
Current usage metrics show cumulative count of Article Views (full-text article views including HTML views, PDF and ePub downloads, according to the available data) and Abstracts Views on Vision4Press platform.
Data correspond to usage on the plateform after 2015. The current usage metrics is available 48-96 hours after online publication and is updated daily on week days.
Initial download of the metrics may take a while.