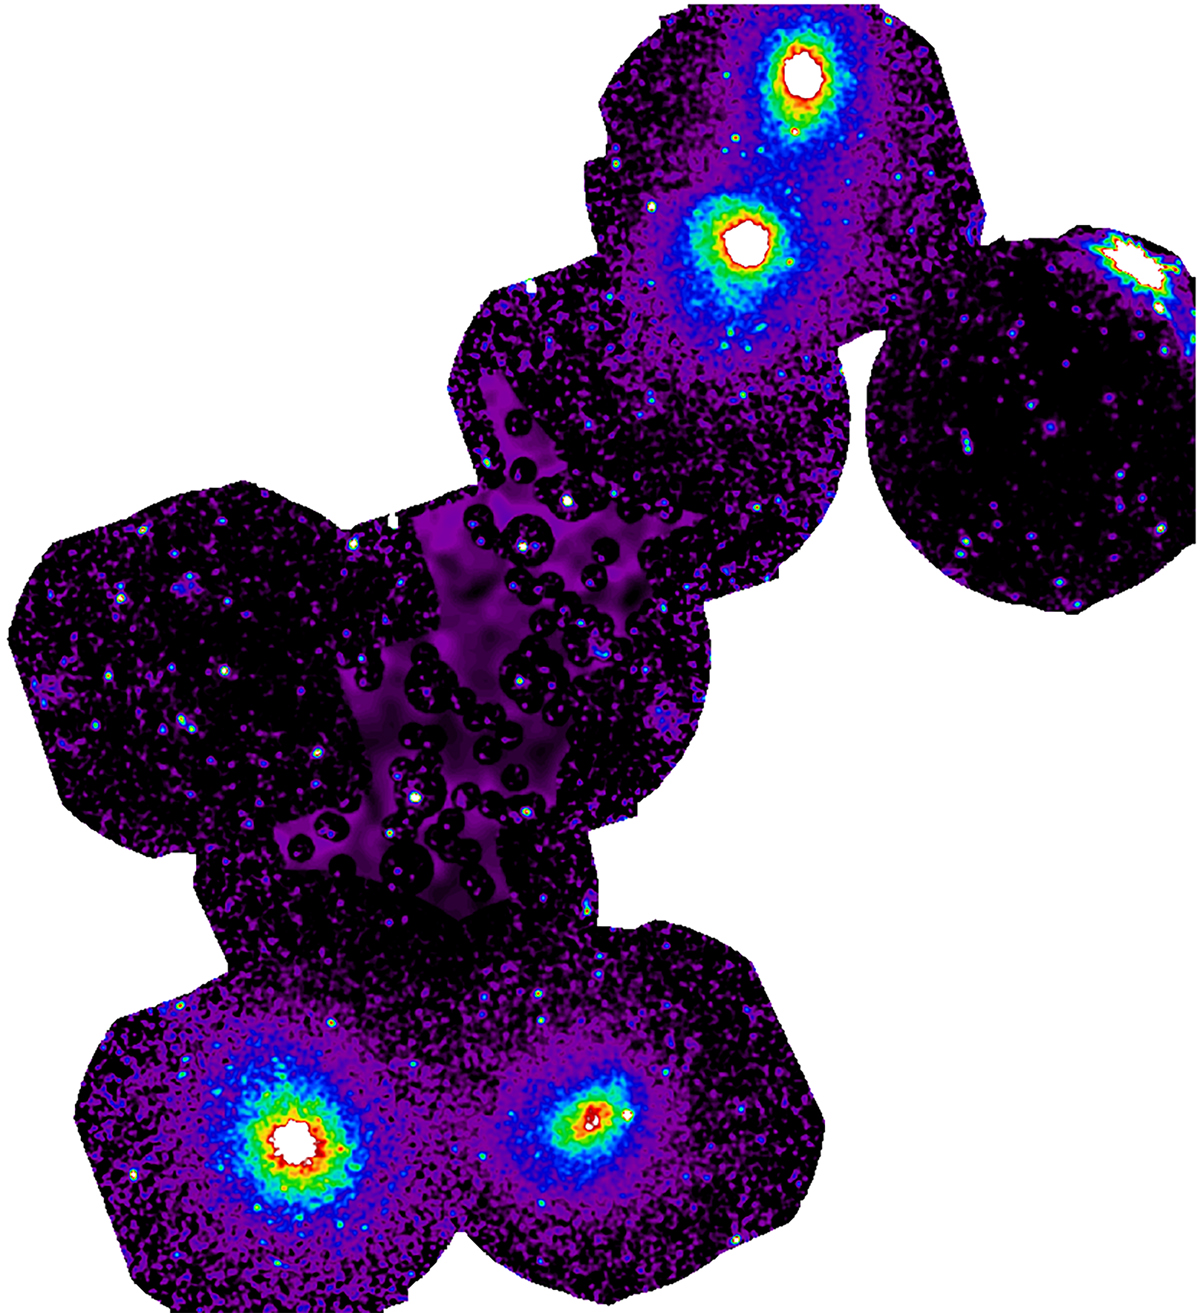
Fig. A.1.
Download original image
Fully cleaned (as in Fig. 1), CXB-subtracted, combined XMM-Newton-Suzaku mosaic image in the 0.5−2 keV band. The Suzaku data were calibrated to the XMM-Newton/MOS count rate. The emission from the cluster outskirts and the AGN residuals was removed from the Suzaku images, thus what is shown here is pure filamentary emission as detected by Suzaku. At the Suzaku's masked areas, the underlying XMM-Newton image is shown instead.
Current usage metrics show cumulative count of Article Views (full-text article views including HTML views, PDF and ePub downloads, according to the available data) and Abstracts Views on Vision4Press platform.
Data correspond to usage on the plateform after 2015. The current usage metrics is available 48-96 hours after online publication and is updated daily on week days.
Initial download of the metrics may take a while.