Fig. 5.
Download original image
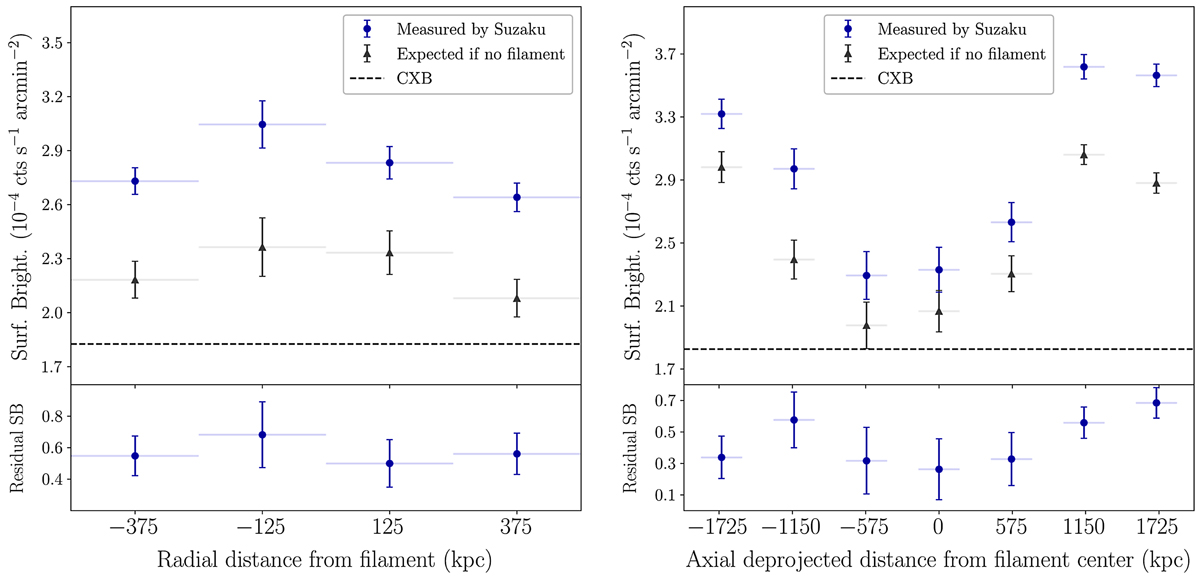
Radial (left) and axial (right) surface brightness profiles of the filament as extracted with Suzaku in the 0.5−2 keV band. Negative and positive distance values correspond, respectively, to east (south) and west (north) boxes in the left (right) panel of Fig. 1. The blue and gray data points respectively show the measured SB and the expected SB if there was no filament, that is, if all the detected emission came from imperfectly masked AGN, cluster outskirts, and the CXB. The CXB level is displayed with the horizontal dashed black line. In the bottom panels the difference between the measured and expected SB values is shown. These residuals represent the genuine emission coming solely from the filament. The emission of the latter is ≈(10−30)% higher than the CXB.
Current usage metrics show cumulative count of Article Views (full-text article views including HTML views, PDF and ePub downloads, according to the available data) and Abstracts Views on Vision4Press platform.
Data correspond to usage on the plateform after 2015. The current usage metrics is available 48-96 hours after online publication and is updated daily on week days.
Initial download of the metrics may take a while.