Fig. 3.
Download original image
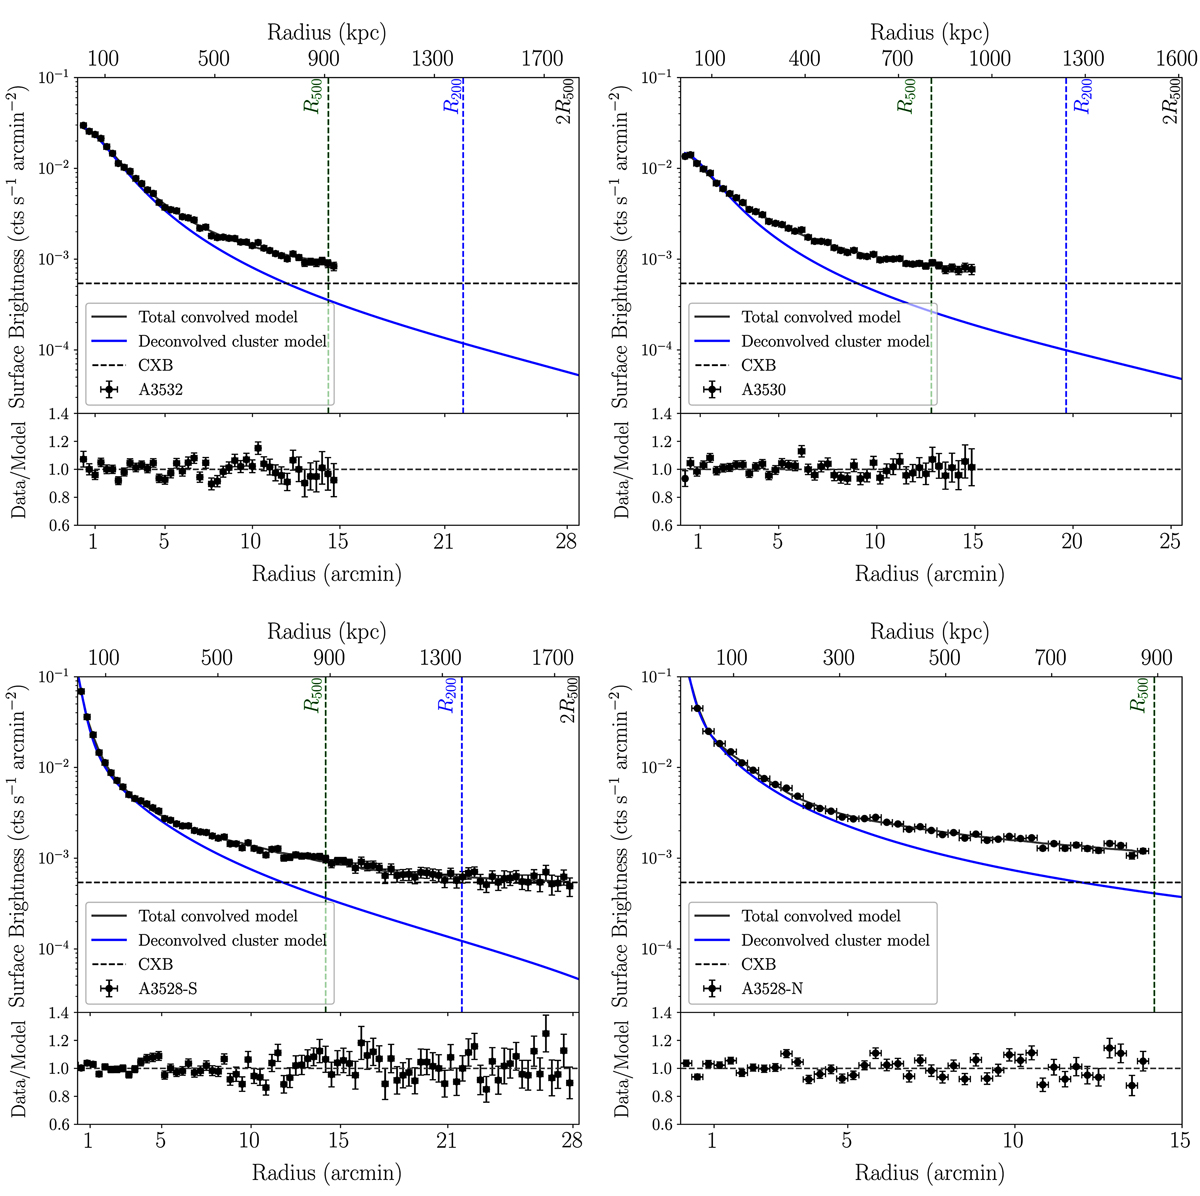
Surface brightness profiles (PIB-subtracted) for the A3532 (top left), A3530 (top right), A3528-S (bottom left), and A3528-N (bottom right) clusters in the 0.5−2 keV band. The total (cluster+CXB), PSF-convolved profiles are displayed in gray, and the best-fit cluster-only PSF-deconvolved profiles are shown by the blue line. The latter is extrapolated up to 2 R500, except for A3528-N, which is only plotted until ≈R500 since it is irrelevant for the analysis of the filament (this plotting difference is the reason why this SB profile appears to be flatter than the others). The R500 and R200 values are displayed with the dashed green and vertical blue lines, respectively. The CXB level is displayed with the horizontal black line. The residuals of the fit are shown for all clusters in the bottom subpanels.
Current usage metrics show cumulative count of Article Views (full-text article views including HTML views, PDF and ePub downloads, according to the available data) and Abstracts Views on Vision4Press platform.
Data correspond to usage on the plateform after 2015. The current usage metrics is available 48-96 hours after online publication and is updated daily on week days.
Initial download of the metrics may take a while.