Fig. 2.
Download original image
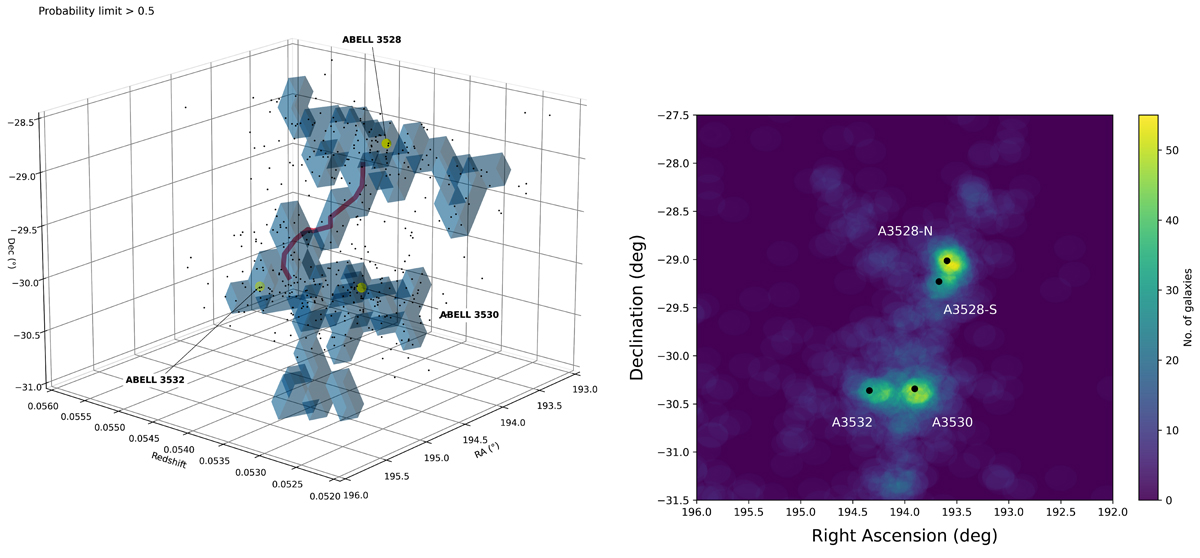
3D (left) and 2D (right) galaxy overdensity throughout the filament based on the spectroscopic optical data. Left: spectroscopic galaxies and cluster centers are shown as black and yellow large dots respectively. The filament volumes detected with T-REx are shown as blue voxels (with a probability cut at 0.5), while the central spine extracted with COWS is shown with a red line. Right: number of galaxies within 8′ from each pixel is displayed color-coded. The black dots show the X-ray cluster centers. The space between the galaxy clusters (identified as the highest galaxy density peaks) shows a clear overdensity compared to the background.
Current usage metrics show cumulative count of Article Views (full-text article views including HTML views, PDF and ePub downloads, according to the available data) and Abstracts Views on Vision4Press platform.
Data correspond to usage on the plateform after 2015. The current usage metrics is available 48-96 hours after online publication and is updated daily on week days.
Initial download of the metrics may take a while.