Fig. E.1.
Download original image
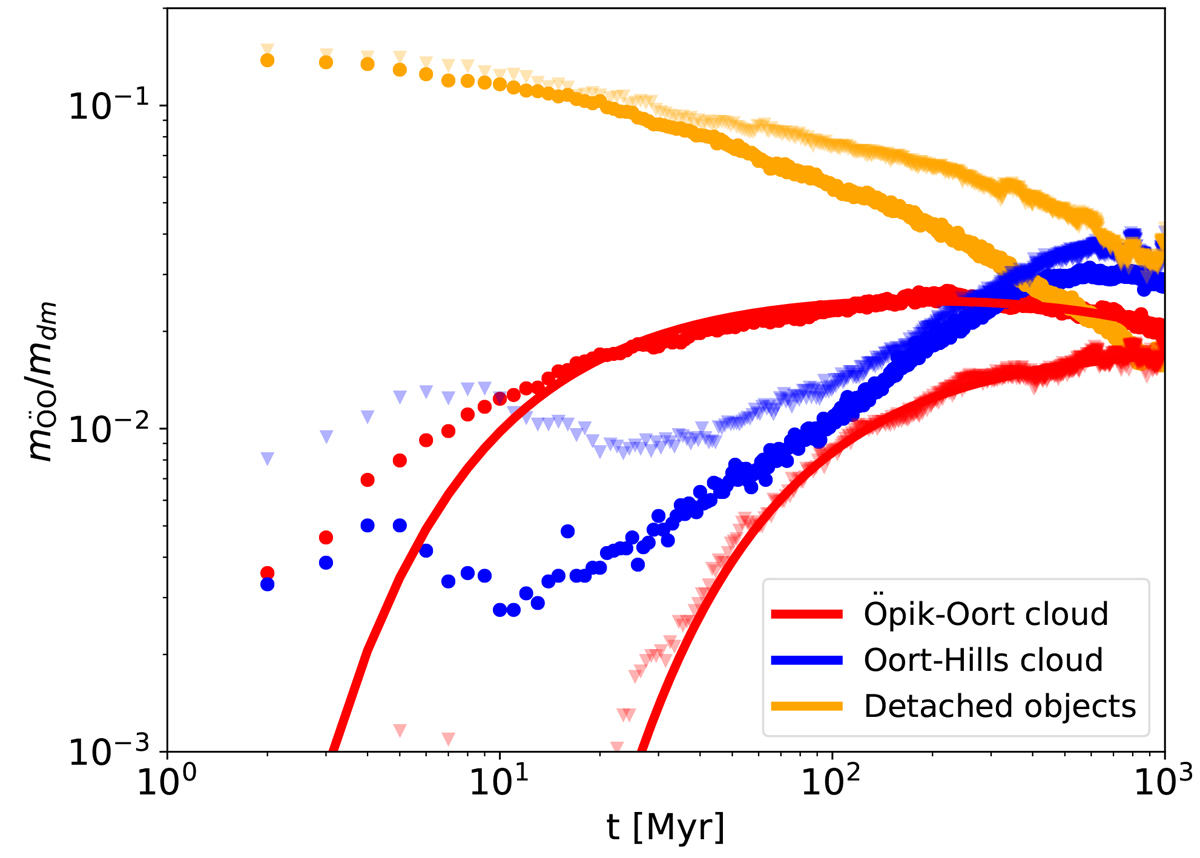
Relative mass evolution of the Oort cloud and detached population. For isolated clusters the mass evolution of the Öpik-Oort cloud, Oort-Hills cloud, and the detached populations are given by the upper red, blue and orange symbols, respectively. The triangles give the mass evolution in the simulation where the Solar System left the cluster 20 Myr after the formation of the giant planets, the bullets for the isolated Solar System. Here we adopted the inner Öpik-Oort cloud boundary of rinner = 30 000 au. The red symbols are identical to the blue and red dots in the main paper’s Fig. 1. The two solid red curves represent the fits to the two Öpik-Oort cloud populations.
Current usage metrics show cumulative count of Article Views (full-text article views including HTML views, PDF and ePub downloads, according to the available data) and Abstracts Views on Vision4Press platform.
Data correspond to usage on the plateform after 2015. The current usage metrics is available 48-96 hours after online publication and is updated daily on week days.
Initial download of the metrics may take a while.