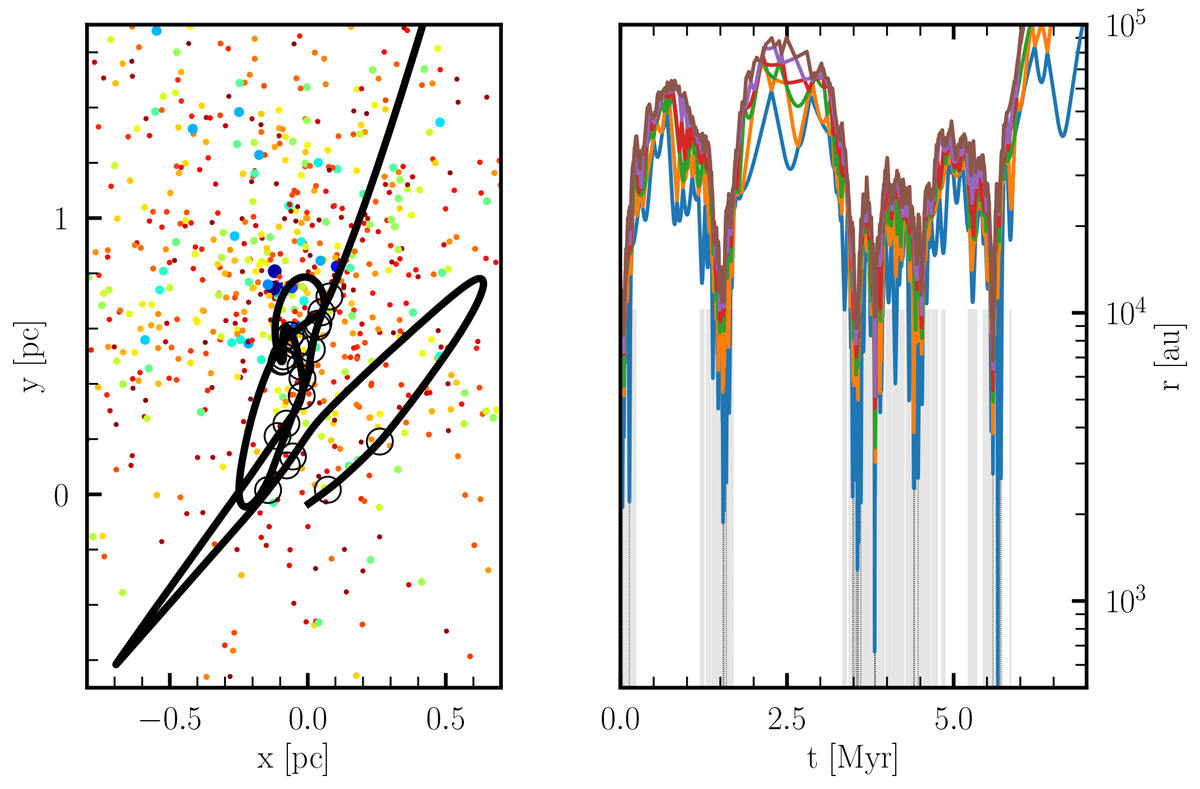
Fig. D.1.
Download original image
Initial cluster (left: rainbow colors and size represent stellar mass) and the orbit of a randomly selected star evolved for 7 Myr (black curve). Circles along the orbit indicate moments of close approach. The right-hand panel shows the distance to the six nearest neighbors as the selected star orbits the cluster. The gray shaded area indicates when another star approaches within 104 au.
Current usage metrics show cumulative count of Article Views (full-text article views including HTML views, PDF and ePub downloads, according to the available data) and Abstracts Views on Vision4Press platform.
Data correspond to usage on the plateform after 2015. The current usage metrics is available 48-96 hours after online publication and is updated daily on week days.
Initial download of the metrics may take a while.