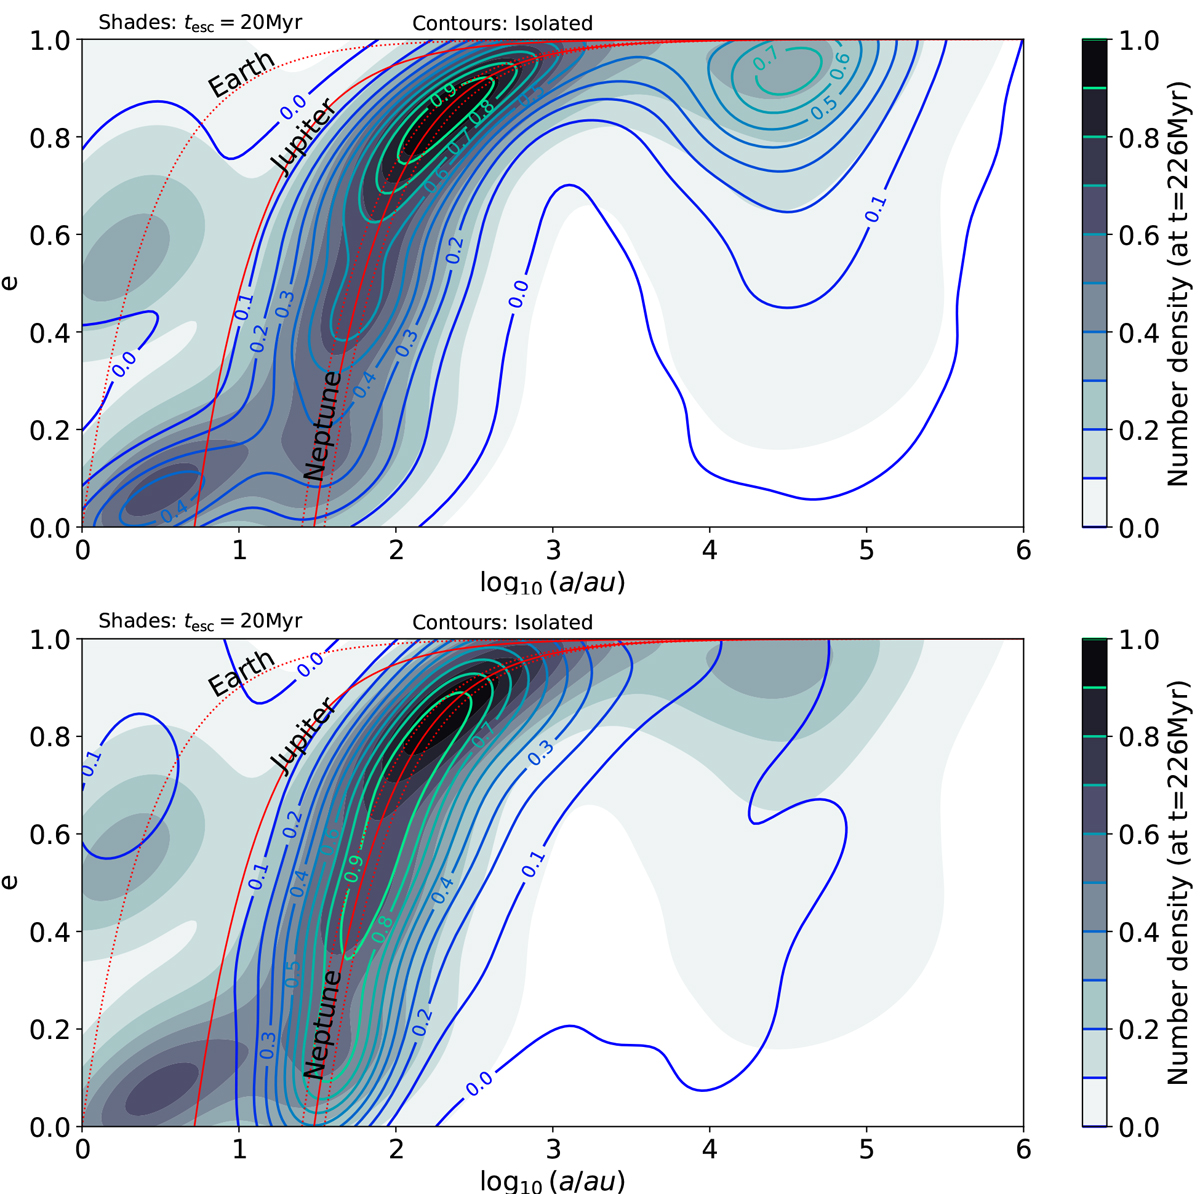
Fig. 4.
Download original image
Distribution of semimajor axis and eccentricity of the Solar System planetesimals. The distributions are presented at their peak, at the age of 226 Myr. The gray shades give the probability density function (linearly interpolated) for the Solar System that was ejected 20 Myr after the formation of the giant planets. The red curves indicate the influence of Earth (left, the dotted curve for reference), Jupiter (middle), and Neptune (rightmost curve). The two dotted curves around Neptune’s influence indicate the range within 5 Hill radii of Neptune. Top panel: Contours (same interpolation) give the probability density distribution for the Solar System that was isolated for its entire lifetime. Bottom panel: Contours (same interpolation and range) refer to the probability density distribution for the Solar System that remained in the cluster for its entire lifetime.
Current usage metrics show cumulative count of Article Views (full-text article views including HTML views, PDF and ePub downloads, according to the available data) and Abstracts Views on Vision4Press platform.
Data correspond to usage on the plateform after 2015. The current usage metrics is available 48-96 hours after online publication and is updated daily on week days.
Initial download of the metrics may take a while.