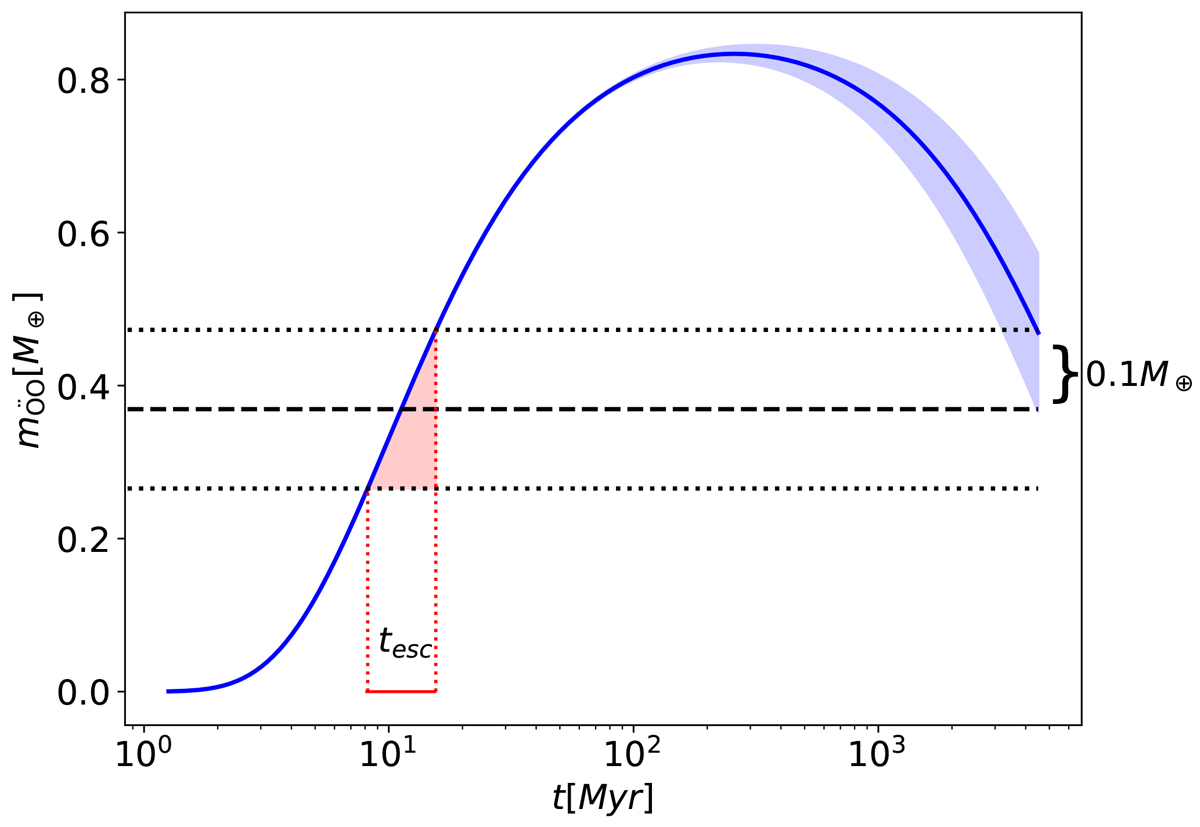
Fig. 2.
Download original image
Reconstruction of the time when the Sun left the parent cluster for a specific set of parameters. The dark blue curve shows the Öpik-Oort cloud’s mass-evolution, assuming it was born in isolation (fast-rise-exponential-decay function with a maximum mass of μÖO = 0.027, trise = 10 Myr, and tdecay = 7500 Myr, see Eq:FRED). The blue-shaded area gives the uncertainty of the Öpik-Oort cloud for tdecay = 5000 Myr to 10 000 Myr (see also fig:currentOCmass in the main paper). The dashed line indicates 0.38 M⊕ below the endpoint of the solid blue curve. The intersections between the dashed line and the solid blue curve (to the left) indicate the moment the Sun left the parent cluster at tesc = 12 ± 4 Myr. The horizontal dotted lines are identical to the dashed line, but present the extremes for the blue-shaded region; they define the uncertainty in tesc, indicated in red.
Current usage metrics show cumulative count of Article Views (full-text article views including HTML views, PDF and ePub downloads, according to the available data) and Abstracts Views on Vision4Press platform.
Data correspond to usage on the plateform after 2015. The current usage metrics is available 48-96 hours after online publication and is updated daily on week days.
Initial download of the metrics may take a while.