Fig. 1.
Download original image
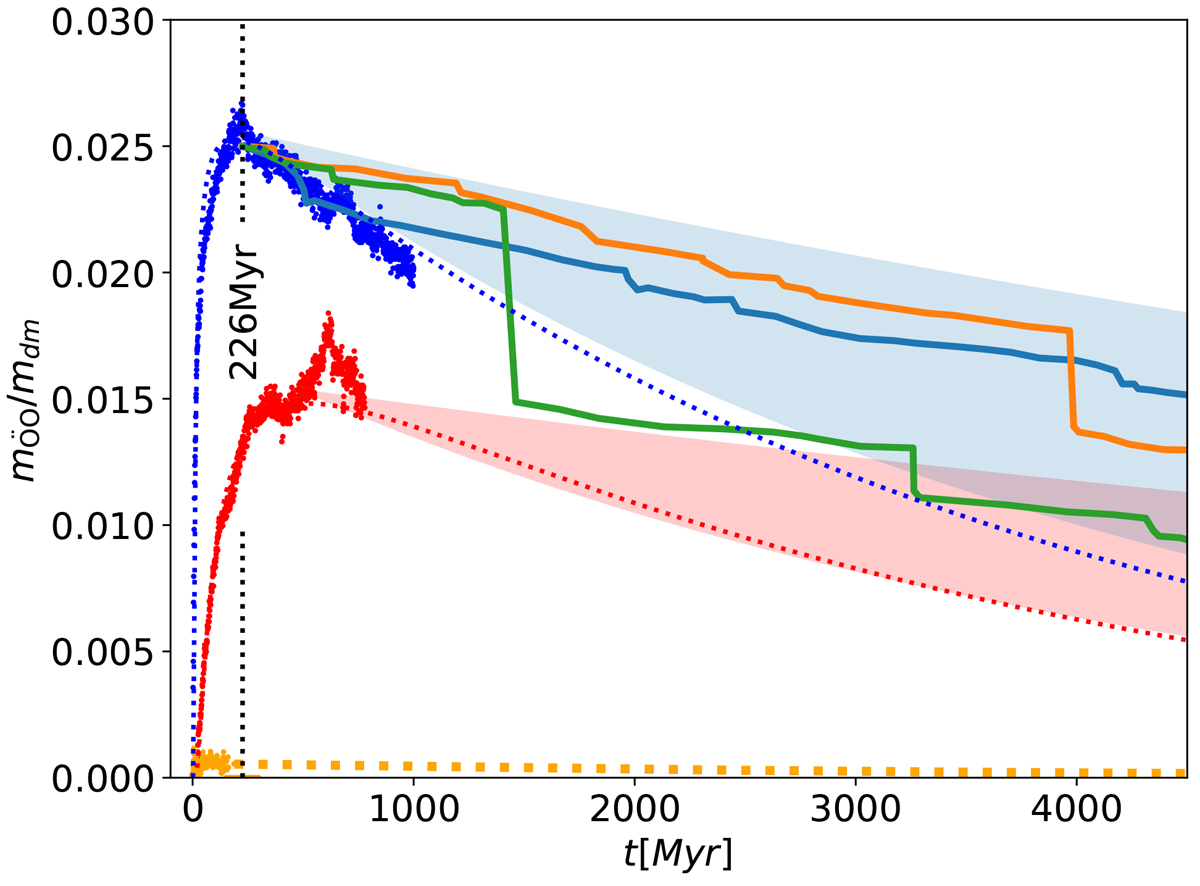
Relative mass (μÖO ≡ mÖO/mdm) evolution of the Öpik-Oort cloud. Blue dots (top left) result from simulating 1000 Myr evolution of the Oort cloud for an isolated Solar System. Orange points (bottom) represent the formation of an Öpik-Oort cloud in a stellar cluster; no appreciable Oort cloud forms in these models. The red dots give the mass evolution of the Oort cloud if the Sun left the parent cluster at an age of 20 Myr. The dotted curves (blue, red, and orange) fit to the simulated data using a fast-rise-exponential-decay (see Sect:Fred), with trise = 10 Myr for the blue and orange curves, 80 Myr for the red curve, and all three curves have tdecay = 3500 Myr. The solid curves give the Öpik-Oort cloud mass-evolution for a star in a Galactic orbit for three independent calculations by Hanse et al. (2018). A similar mass evolution of the Öpik-Oort cloud was already calculated by Kaib & Quinn (2008, see their Fig. 7b). The large jumps in these curves result from encounters with other Galactic stars. The blue-shaded region shows the uncertainty interval derived from these calculations (Hanse et al. 2018). The red-shaded region provides the uncertainty interval of a similar analysis for a Solar System that left the parent cluster after 20 Myr. Both areas are bracketed by tdecay = 4000 Myr and tdecay = 13 000 Myr. The vertical black-dotted curve indicates the moment of reaching the maximum Oort-cloud mass for the isolated Solar System (see Sect:Methods). From this moment, Galactic erosion went on to dominate the Oort cloud’s evaporation.
Current usage metrics show cumulative count of Article Views (full-text article views including HTML views, PDF and ePub downloads, according to the available data) and Abstracts Views on Vision4Press platform.
Data correspond to usage on the plateform after 2015. The current usage metrics is available 48-96 hours after online publication and is updated daily on week days.
Initial download of the metrics may take a while.