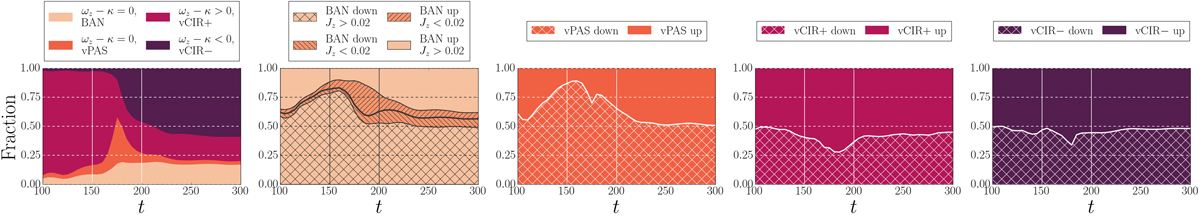
Fig. 2.
Download original image
The evolution of the fraction between different types of orbits from t = 100 to t = 300. In all plots, the buckling stage (t = 150 − 200) is highlighted by vertical lines. From left to right: among orbits in ILR (the bar), among ILR orbits captured in vILR (BAN), among ILR orbits passing through vILR (heating), among ILR orbits with increasing resonant angle θz − θR (vCIR+, flat orbits) and among ILR orbits with decreasing resonant angle θz − θR (vCIR−). The different types of orbits in plots, starting with the second, are shown in the same colors used in the first plot. All types correspond to those shown in Fig. 1.
Current usage metrics show cumulative count of Article Views (full-text article views including HTML views, PDF and ePub downloads, according to the available data) and Abstracts Views on Vision4Press platform.
Data correspond to usage on the plateform after 2015. The current usage metrics is available 48-96 hours after online publication and is updated daily on week days.
Initial download of the metrics may take a while.