Fig. 1.
Download original image
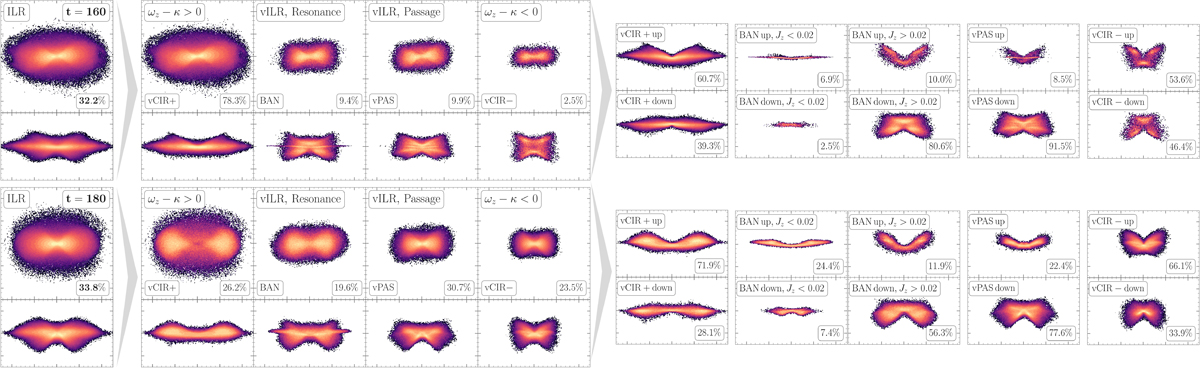
Dynamic decomposition of the bar (ILR) at the beginning of buckling (t = 160, two top row) and at the peak of buckling (t = 180, two bottom row). For each time moment, the five leftmost snapshots on the xy-plane, covering [ − 2.5, 2.5]×[−2.5, 2.5], and on the xz-plane, covering [ − 2.5, 2.5]×[−1.5, 1.5], are shown. From left to right: All bar orbits (ILR); orbits with increasing resonant angle, θres = θz − θR (vCIR+); orbits in the vILR (BAN); orbits passing through it (vPAS); and orbits with decreasing θres (vCIR−). The next five snapshots show the same orbits on the xz-plane, but separated into “up” (near θres = 0) and “down” (near θres = π) types, and into secular Jz < 0.02 (very flat) and Jz > 0.02 (thick) for BAN orbits. For more information on the classification of these types, see Sect. 3 and Appendix A.
Current usage metrics show cumulative count of Article Views (full-text article views including HTML views, PDF and ePub downloads, according to the available data) and Abstracts Views on Vision4Press platform.
Data correspond to usage on the plateform after 2015. The current usage metrics is available 48-96 hours after online publication and is updated daily on week days.
Initial download of the metrics may take a while.