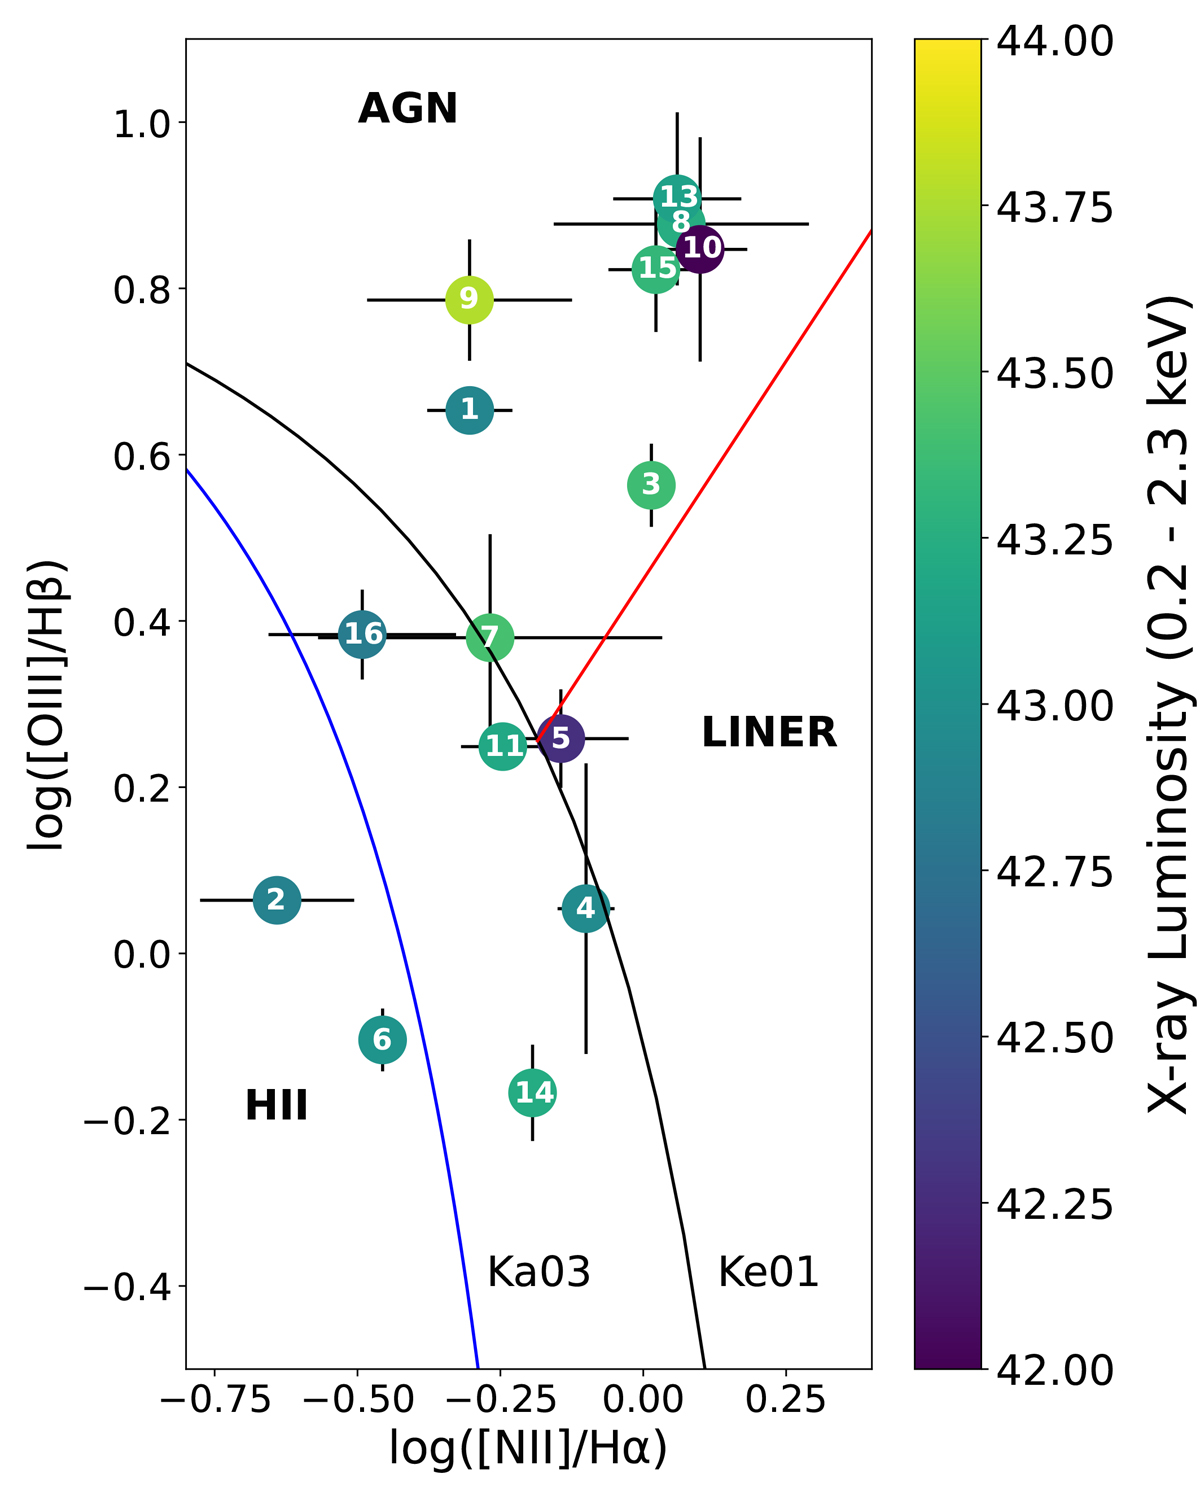
Fig. 6.
Download original image
[N ii]-BPT ([O iii]λ5007/Hβ versus [N ii]λ6583/Hα) diagnostic diagram for the SMBHB candidates. The black curve marks the separation proposed by Kewley et al. (2001, denoted as Ke01 in the diagrams), between the theoretical maximum ionization driven by pure star-formation in HII regions and those regions ionized by AGN. The red solid line on the BPT diagram marks the separation between AGN and Low Ionization Narrow Emission-line Regions (LINERs), as proposed by Schawinski et al. (2007), while the blue solid curve represents the separation between AGN and star formation reported by Kauffmann et al. (2003) denoted as Ka03 on the [NII]-BPT diagram. The markers are color-coded according to the observed eROSITA luminosity of the bright level in the 0.2–2.3 keV band. The numbers of the markers correspond to the sources listed in Table 1.
Current usage metrics show cumulative count of Article Views (full-text article views including HTML views, PDF and ePub downloads, according to the available data) and Abstracts Views on Vision4Press platform.
Data correspond to usage on the plateform after 2015. The current usage metrics is available 48-96 hours after online publication and is updated daily on week days.
Initial download of the metrics may take a while.