Fig. 5.
Download original image
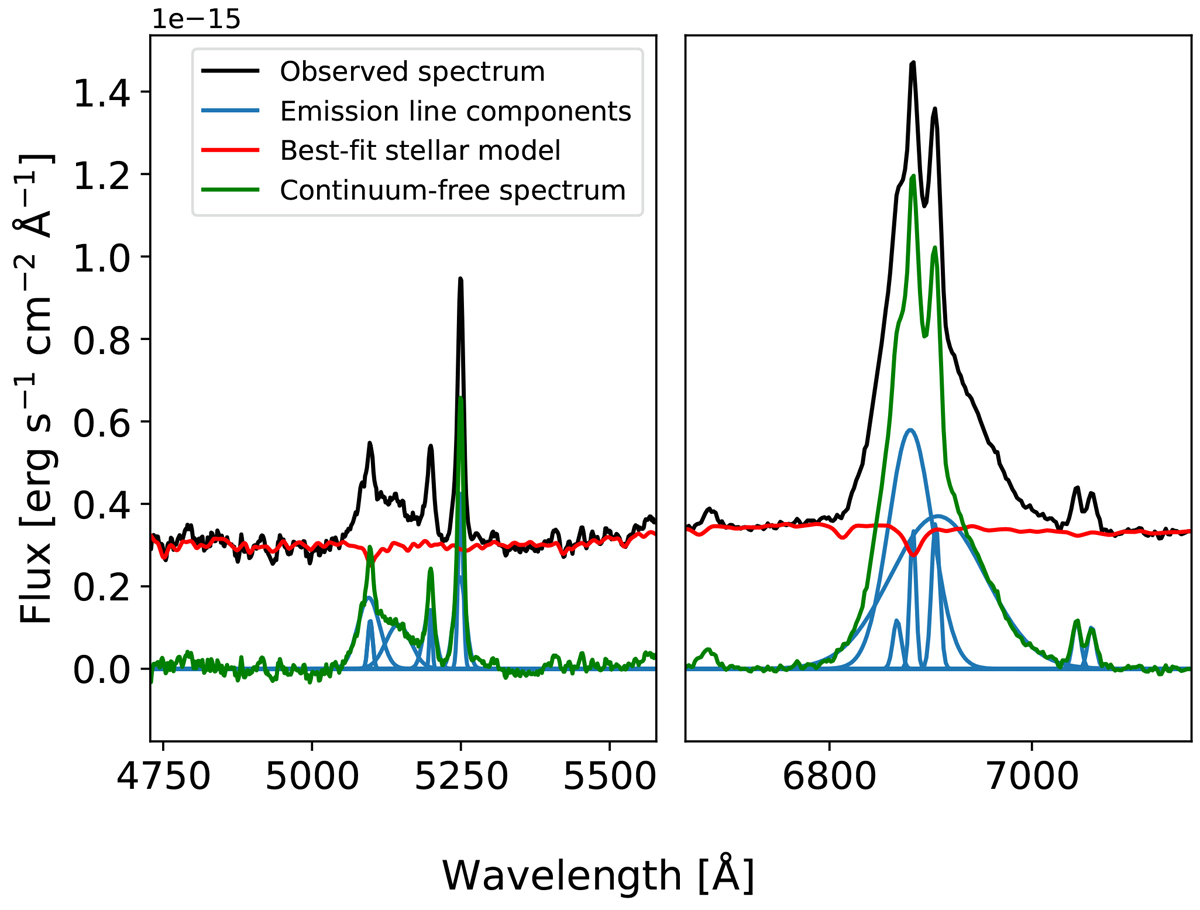
Visualization of the full spectral fit of eRASSt J1906-4850 Magellan/Baade spectrum. The observed spectrum of the galaxy is shown in black, while the pPXF best-fit stellar model is shown in red. A continuum-free emission-line spectrum is shown in green, and the individual Gaussian components are shown in blue. We show the Hβ + [O iii] complex and the Hα + [N ii] + [S ii] in the left and right panel, respectively.
Current usage metrics show cumulative count of Article Views (full-text article views including HTML views, PDF and ePub downloads, according to the available data) and Abstracts Views on Vision4Press platform.
Data correspond to usage on the plateform after 2015. The current usage metrics is available 48-96 hours after online publication and is updated daily on week days.
Initial download of the metrics may take a while.