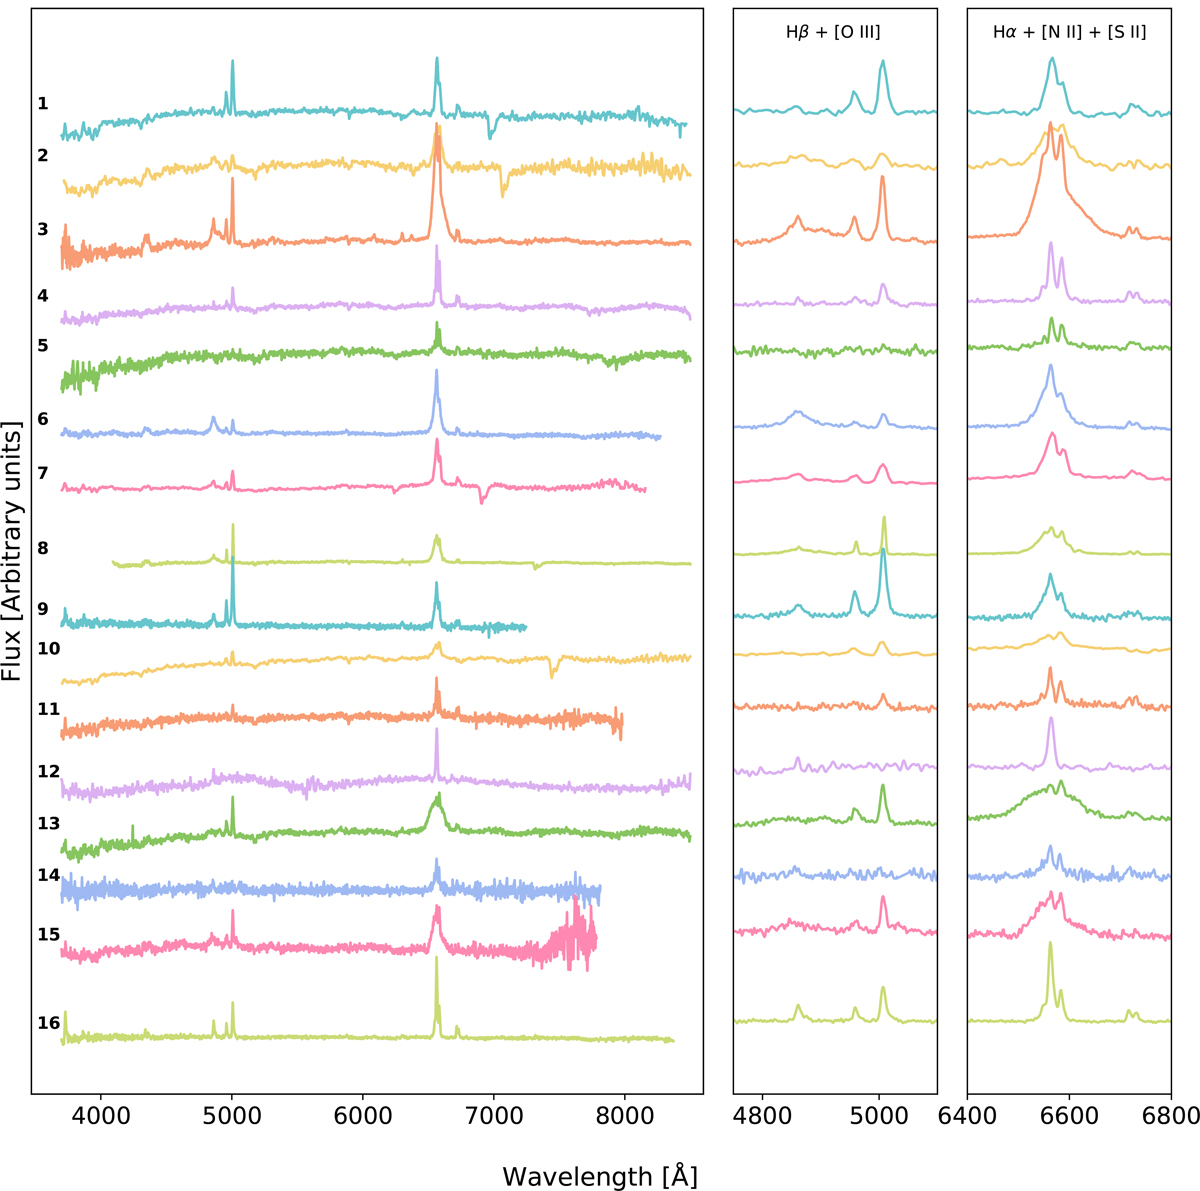
Fig. 4.
Download original image
Optical spectra compilation of the best SMBHB candidates in their rest frame. The spectra are sorted from top to bottom based on the column factor F from Table 1, described in Sect. 2.2. The middle and right panels zoom into the Hβ + [O iii] and the Hα + [N ii] + [S ii] emission lines complex of each spectrum, respectively. The numbers in the plot correspond to every source listed in Table 1. The flux is given in arbitrary units where the spectra were scaled by different factors and added a constant offset of a few 10−16 erg s−1 cm−2 Å −1 to visualize better the different spectral shapes of the SMBHB candidates.
Current usage metrics show cumulative count of Article Views (full-text article views including HTML views, PDF and ePub downloads, according to the available data) and Abstracts Views on Vision4Press platform.
Data correspond to usage on the plateform after 2015. The current usage metrics is available 48-96 hours after online publication and is updated daily on week days.
Initial download of the metrics may take a while.