Fig. 2.
Download original image
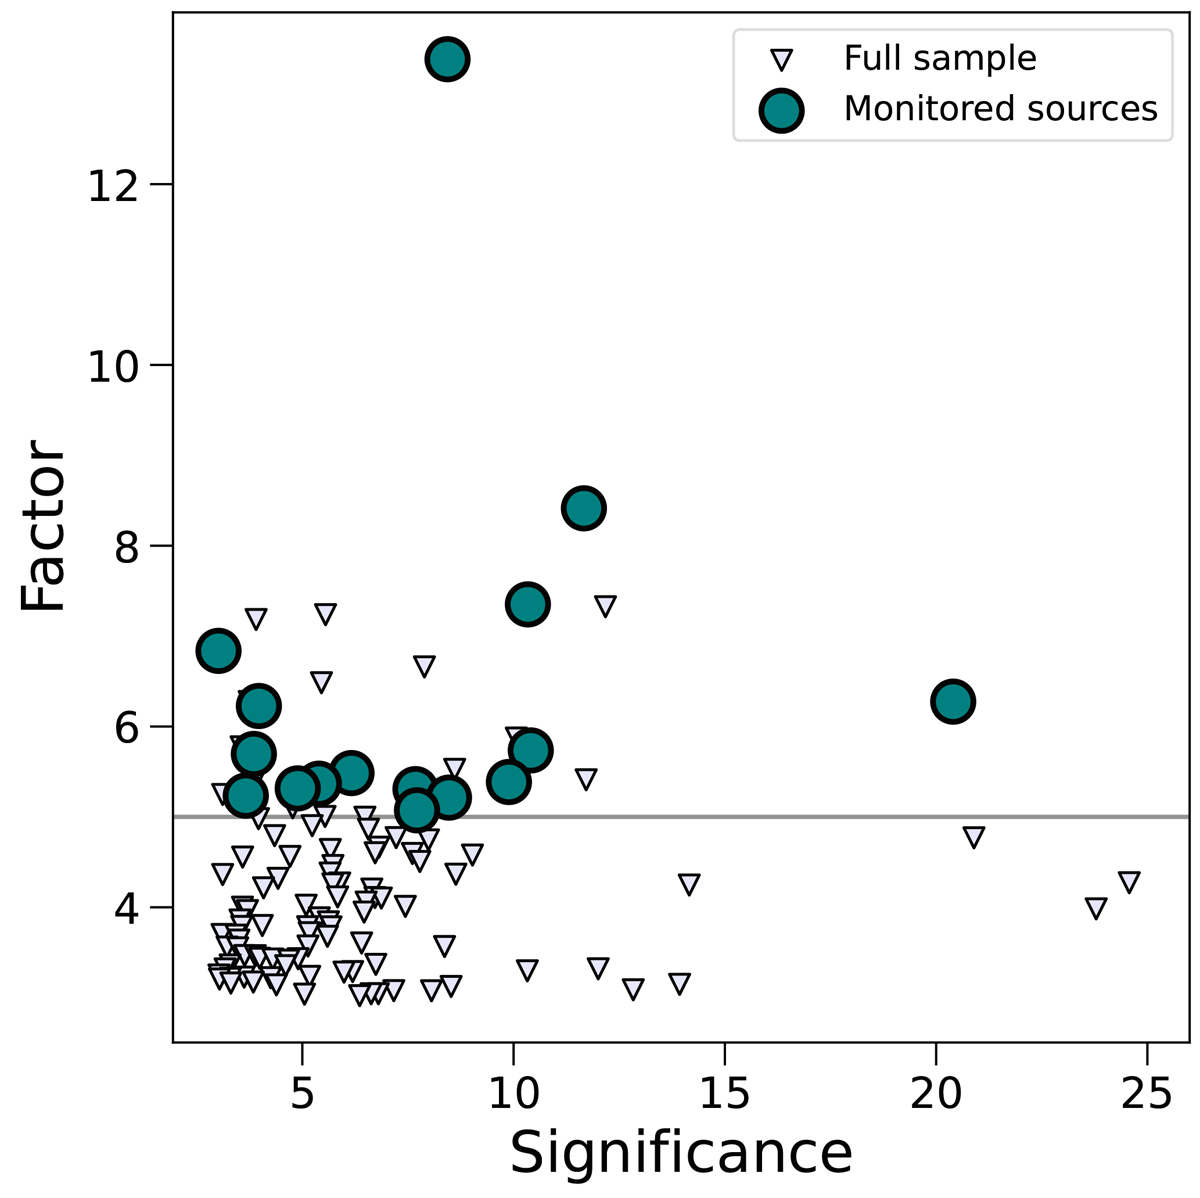
Distribution of the sample based on the factor (F=Fbright/Ffaint) and significance 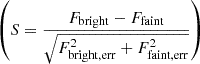 values (see Sect. 2.2). For each source, the factor and significance are calculated between the bright and faint states represented by the blue-shaded area in Fig. 1. We make a cut at F>5 and highlight the 16 sources that will be the focus of this paper. The remaining extragalactic sources of the sample are displayed with triangles.
Current usage metrics show cumulative count of Article Views (full-text article views including HTML views, PDF and ePub downloads, according to the available data) and Abstracts Views on Vision4Press platform.
Data correspond to usage on the plateform after 2015. The current usage metrics is available 48-96 hours after online publication and is updated daily on week days.
Initial download of the metrics may take a while.