Fig. A.2.
Download original image
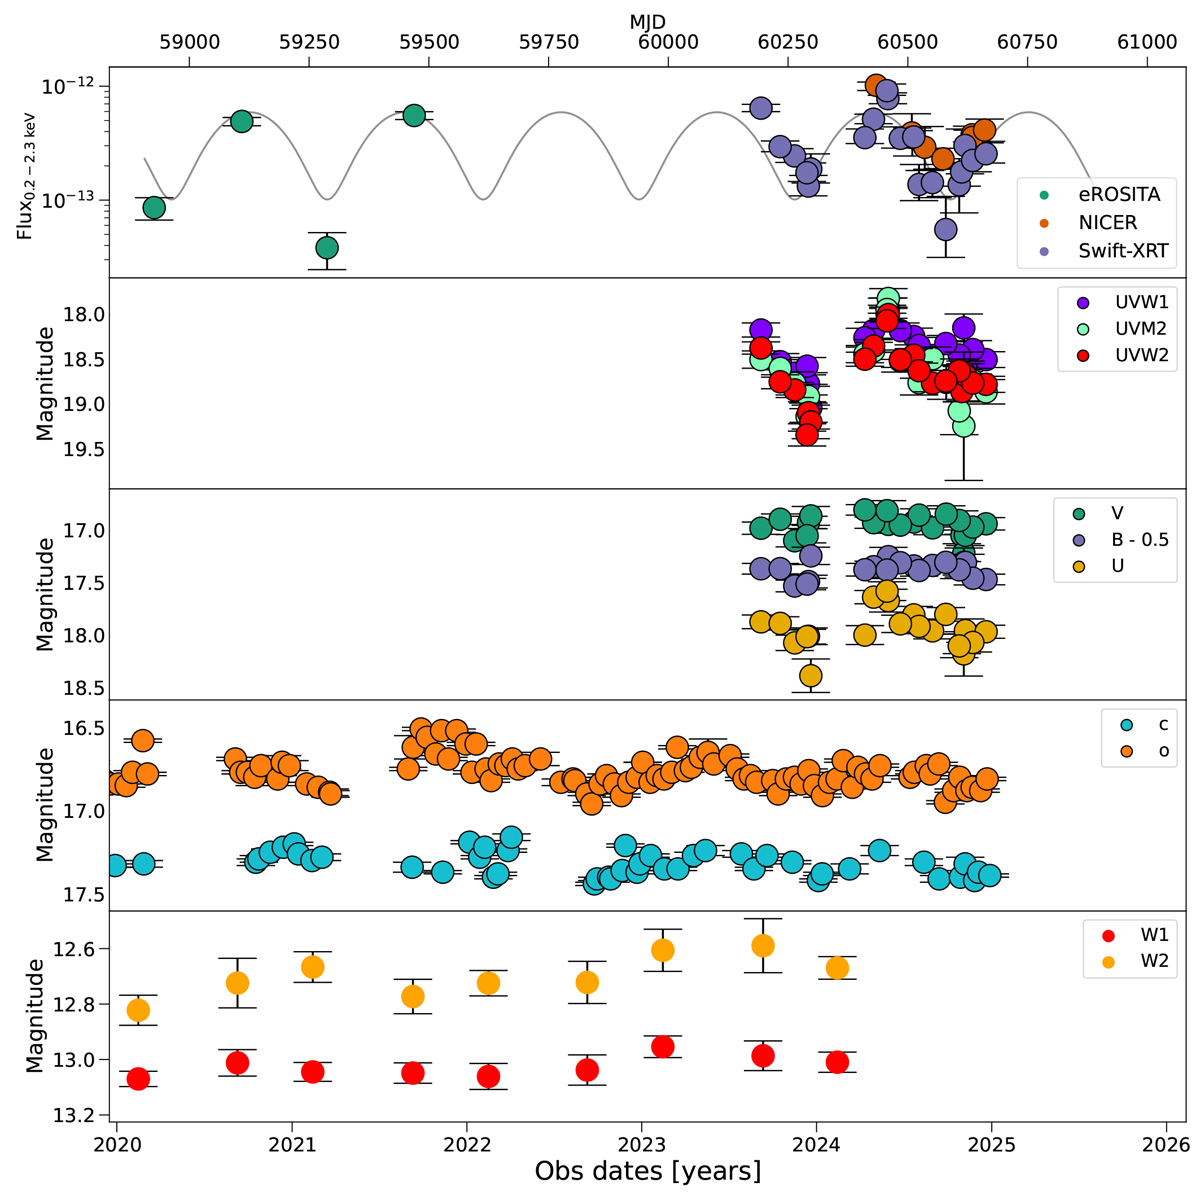
Multiwavelength light curve of eRASSt J0530-4125. The first panel shows the X-ray data from SRG/eROSITA+ Swift-XRT+ NICER at the 0.2–2.3 keV band. UV and optical light curves from Swift-UVOT are shown in the second and third panels, while optical and IR light curves, obtained from ATLAS and WISE, are displayed in the fourth and fifth panels, respectively.
Current usage metrics show cumulative count of Article Views (full-text article views including HTML views, PDF and ePub downloads, according to the available data) and Abstracts Views on Vision4Press platform.
Data correspond to usage on the plateform after 2015. The current usage metrics is available 48-96 hours after online publication and is updated daily on week days.
Initial download of the metrics may take a while.