Fig. A.1.
Download original image
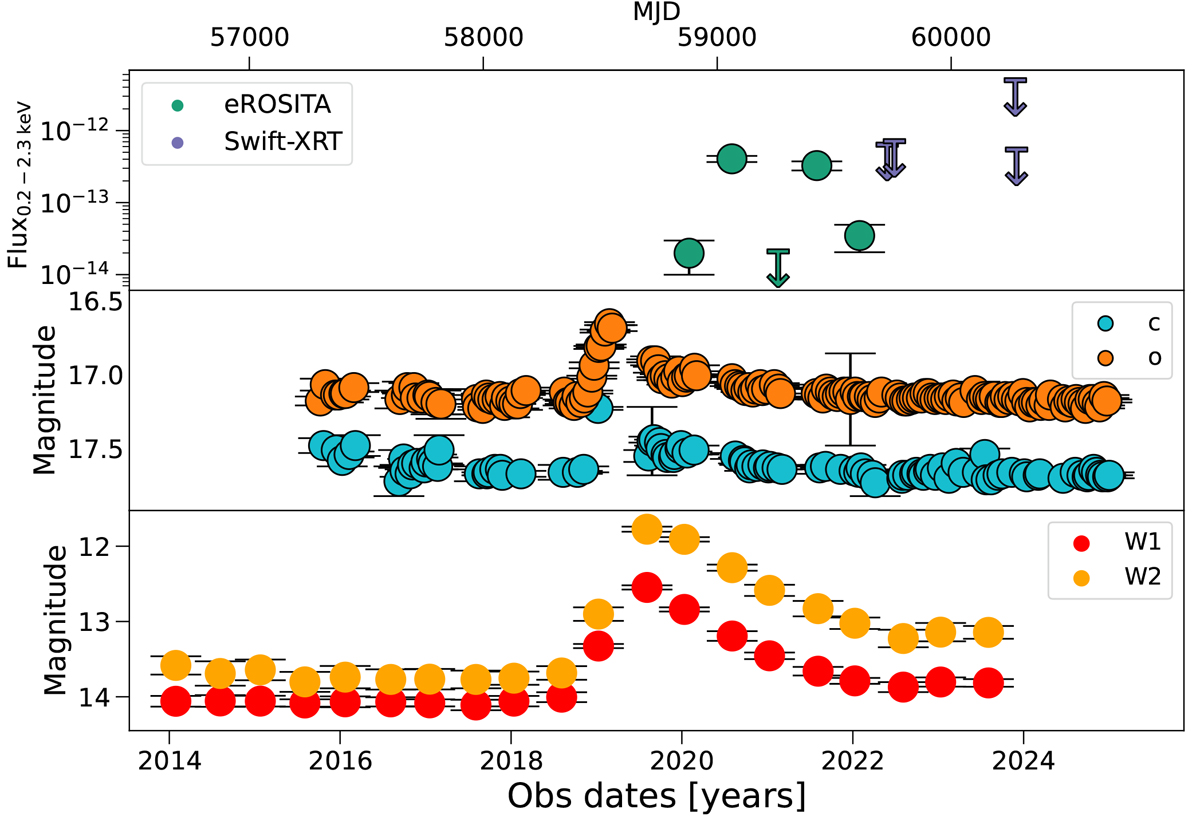
Multiwavelength light curve of eRASSt J0344-3327. X-ray data is given by SRG/eROSITA (green markers) and Swift-XRT (purple upper limits) in the top panel. Optical data is retrieved from ATLAS in their ”c” and ”o” bands (light-blue and orange markers) and presented in bins of 15 days in the middle panel. The WISE light curve (red and yellow markers) is shown in the bottom panel.
Current usage metrics show cumulative count of Article Views (full-text article views including HTML views, PDF and ePub downloads, according to the available data) and Abstracts Views on Vision4Press platform.
Data correspond to usage on the plateform after 2015. The current usage metrics is available 48-96 hours after online publication and is updated daily on week days.
Initial download of the metrics may take a while.