Fig. 1.
Download original image
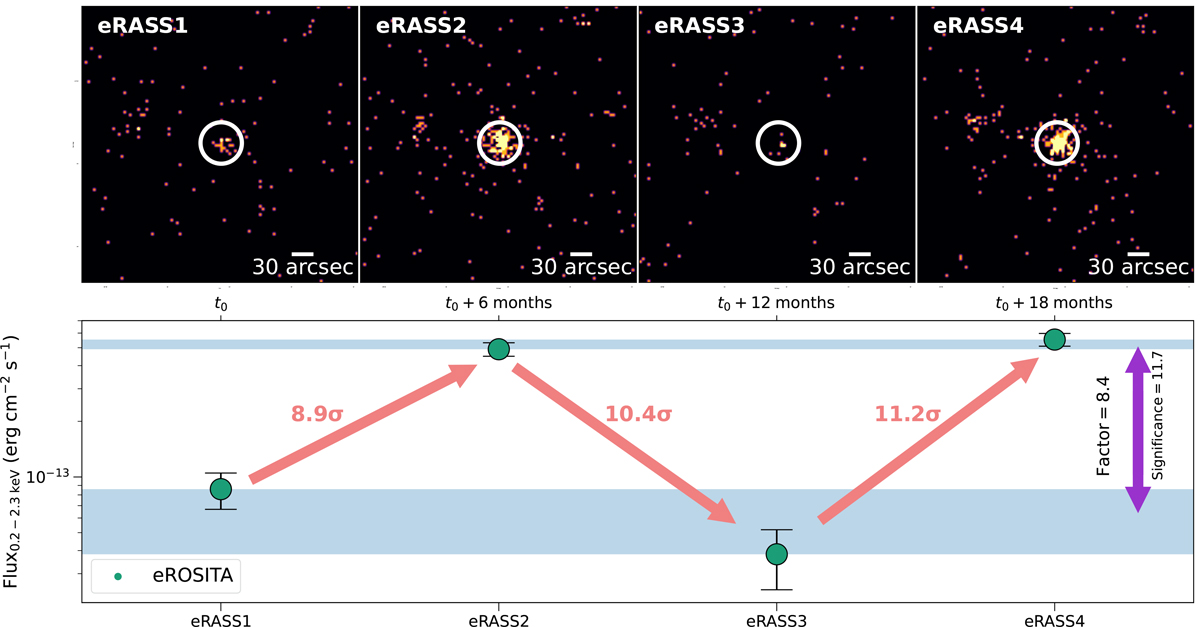
Visualization of the selection for SMBHB candidates based on their SRG/eROSITA light curves. Top panel: Observed counts at the position of the source eRASSt J0530-4125 (see Table 1) at every SRG/eROSITA scan in the 0.2–2.3 keV energy band. Each image is temporarily spaced every six months. The white circles correspond to a typical aperture with a radius of 30″, similar to the scale bar displayed on the bottom right side of each panel. Lower panel: X-ray light curve of eRASSt J0530-4125. The colored arrows indicate the significance of the flux change between the consecutive scans. The blue-shaded areas indicate the bright and faint flux levels of the source, while the purple arrow shows the factor and significance between these two flux levels.
Current usage metrics show cumulative count of Article Views (full-text article views including HTML views, PDF and ePub downloads, according to the available data) and Abstracts Views on Vision4Press platform.
Data correspond to usage on the plateform after 2015. The current usage metrics is available 48-96 hours after online publication and is updated daily on week days.
Initial download of the metrics may take a while.