Open Access
Fig. 5.
Download original image
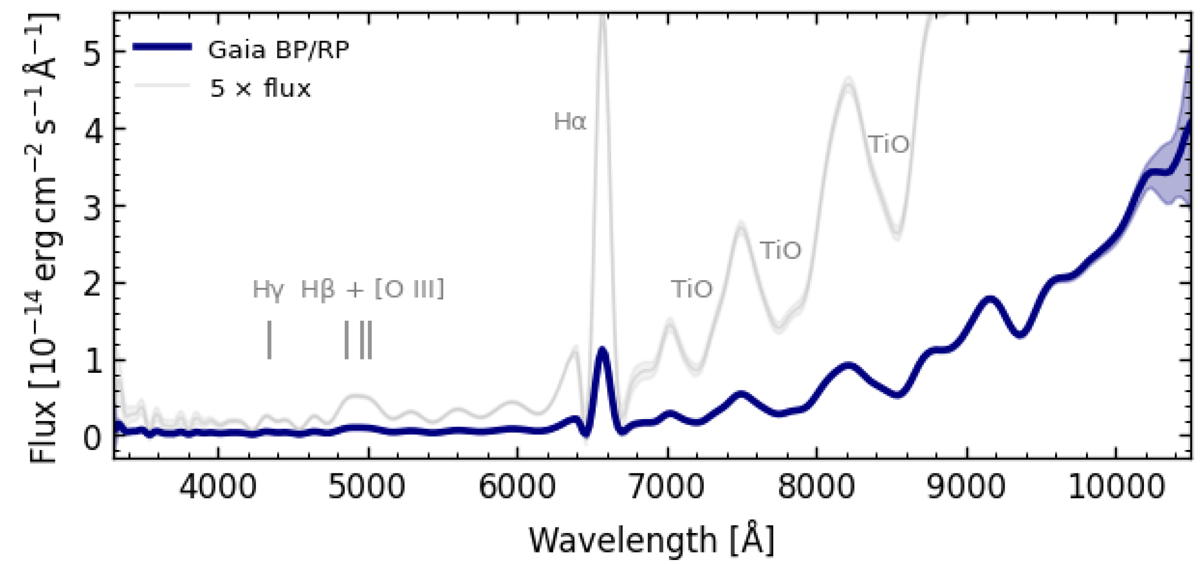
Gaia BP/RP spectrum of V4141 Sgr. The gray curve shows the flux multiplied by a factor of five to enhance the visibility of fainter features. Flux uncertainties, as reported in the Gaia DR3 catalog, are shown as shaded regions. The most prominent emission and absorption lines and bands are marked.
Current usage metrics show cumulative count of Article Views (full-text article views including HTML views, PDF and ePub downloads, according to the available data) and Abstracts Views on Vision4Press platform.
Data correspond to usage on the plateform after 2015. The current usage metrics is available 48-96 hours after online publication and is updated daily on week days.
Initial download of the metrics may take a while.