Fig. 1.
Download original image
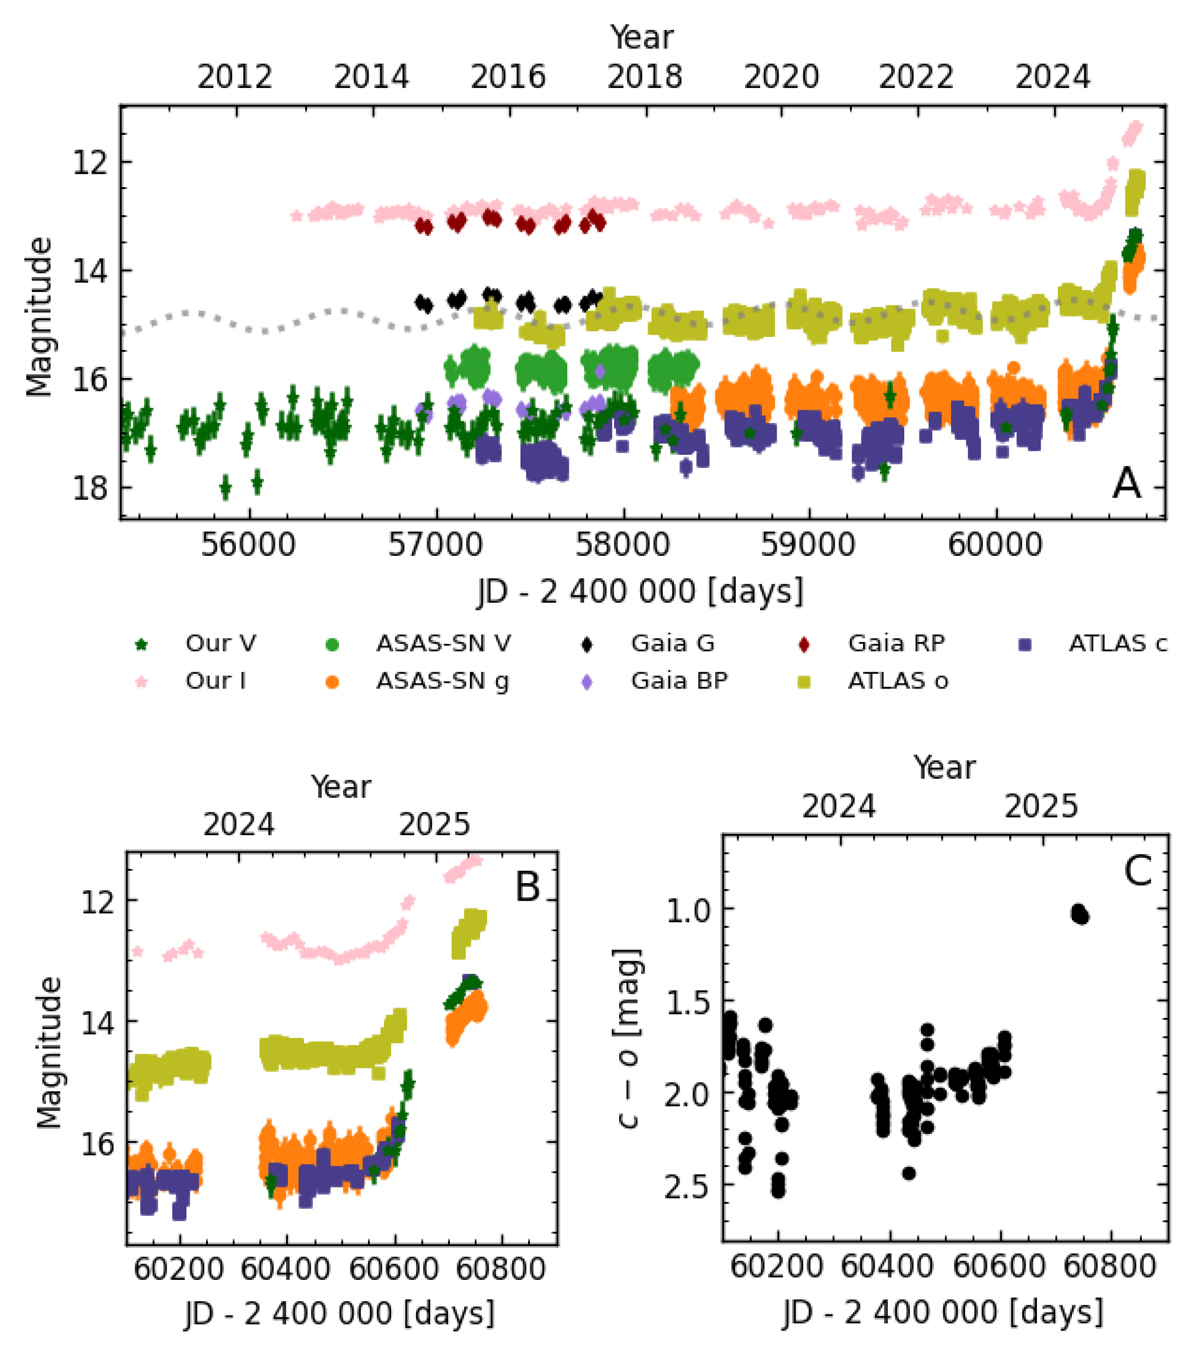
Recent light curves of V4141 Sgr. A: Our photometric observations, together with data from ASAS-SN, ATLAS, and Gaia, covering the period from ∼2010 to 2025. The dashed sinusoidal curve represents the apparent long-term variability of the star. B: Zoomed-in view of the photometric evolution during the recent brightening. C: Color evolution derived from ATLAS c- and o-band observations.
Current usage metrics show cumulative count of Article Views (full-text article views including HTML views, PDF and ePub downloads, according to the available data) and Abstracts Views on Vision4Press platform.
Data correspond to usage on the plateform after 2015. The current usage metrics is available 48-96 hours after online publication and is updated daily on week days.
Initial download of the metrics may take a while.