Fig. 8.
Download original image
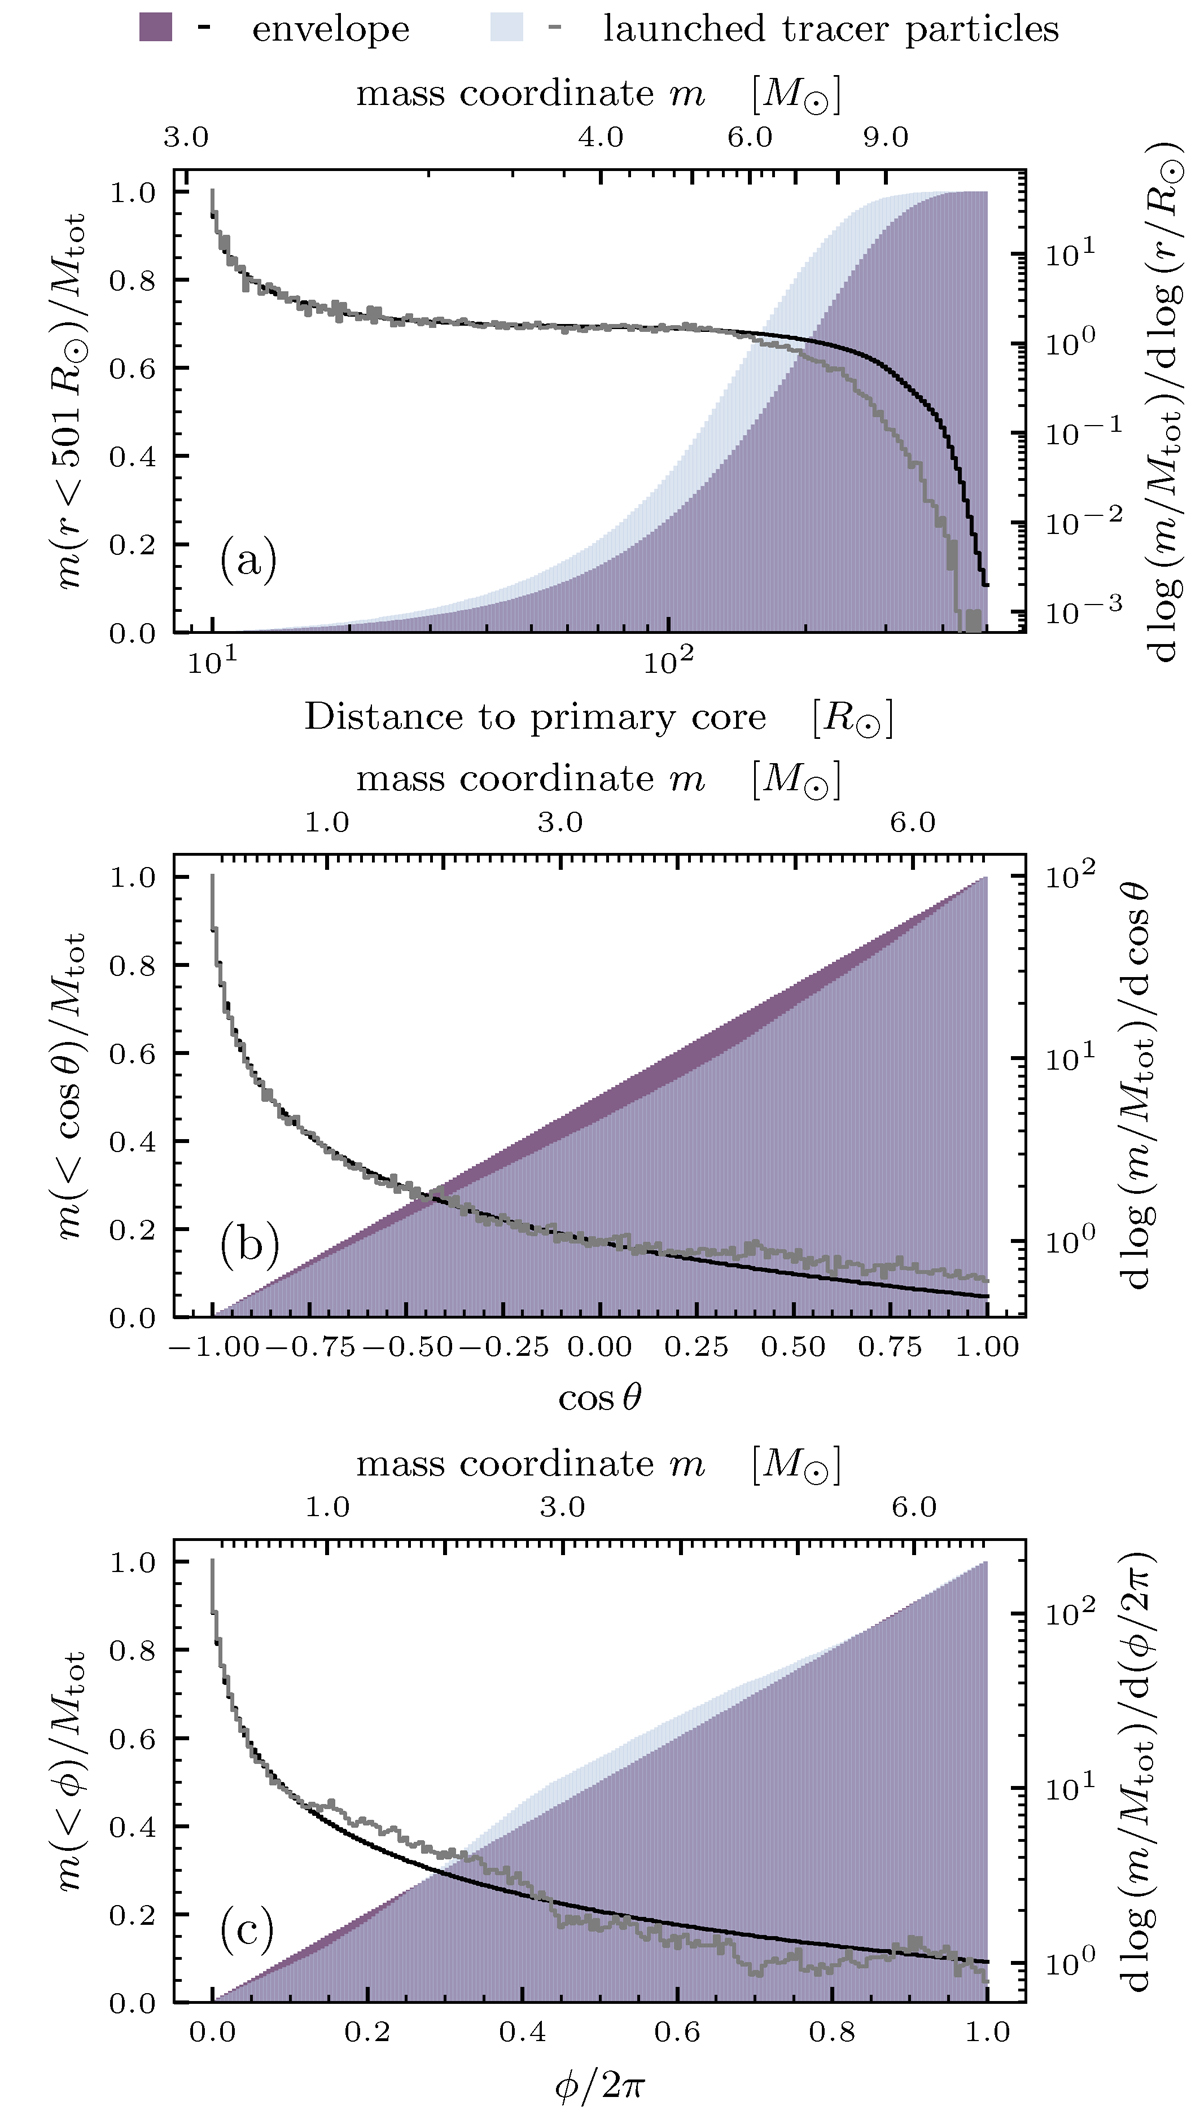
Initial distribution of the launched tracer particles within the envelope. Shown are the normalized cumulative mass distributions m(< x)/Mtot as well as its derivative along the radial (x = r, to 501 R⊙), the polar (x = cos θ) and the azimuthal angle (x = ϕ) in (a), (b) and (c), respectively. The distributions for the total envelope and the launched tracer particle exceeding vr = 110 km s−1 (see Sect. 3.4) are plotted in violet and blue bars, respectively. The derivatives are plotted as black and gray lines. The companion is located at r = 501 R⊙, cosθ = 0 and ϕ = π.
Current usage metrics show cumulative count of Article Views (full-text article views including HTML views, PDF and ePub downloads, according to the available data) and Abstracts Views on Vision4Press platform.
Data correspond to usage on the plateform after 2015. The current usage metrics is available 48-96 hours after online publication and is updated daily on week days.
Initial download of the metrics may take a while.