Fig. 4.
Download original image
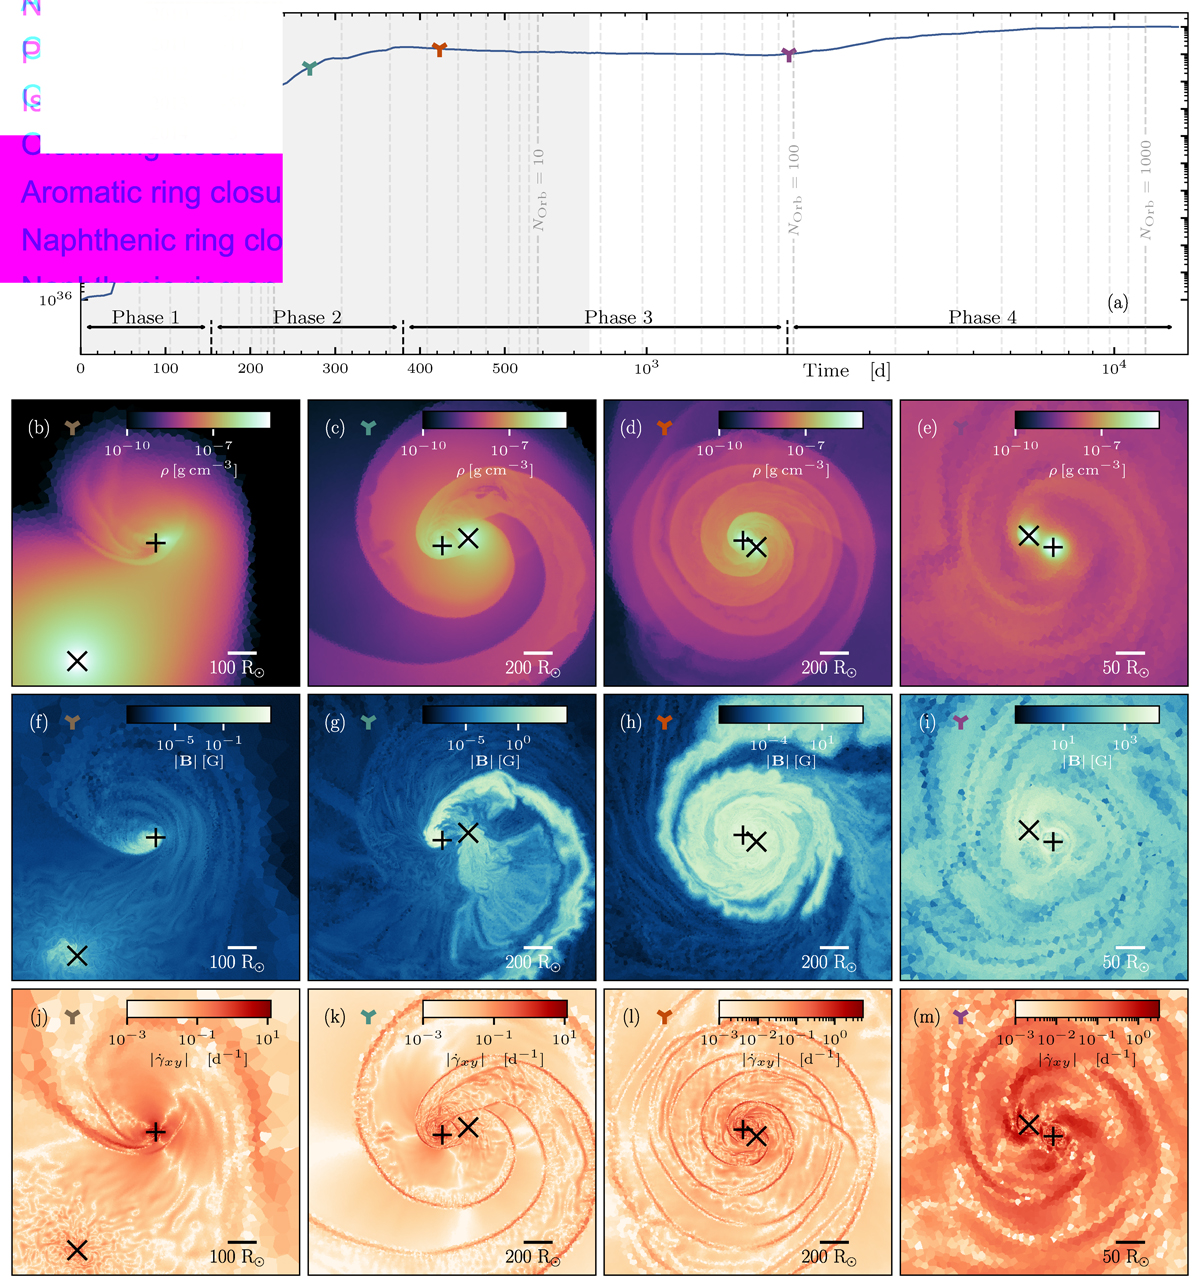
Panel (a): Temporal evolution of the total magnetic energy. The labels “Phase 1” to “Phase 4” are for the different magnetic field amplification phases observed in our simulation (see Sect. 3.2) and the gray shaded region highlights the in-spiral phase defined as the time for which |ȧ/a|P > 0.05, with a being the orbital separation and P being the orbital period. Panels (b)–(e), (f)–(i) and (j)–(m): Density ρ, absolute value of the magnetic field |B| and the absolute value of the local shear rate in the orbital plane ![]() , respectively. The colored markers in panels (b)–(m) are the same as those in panel (a) and indicate the time at which the quantities are shown. The primary core and companion are again marked by a “x” and “+” symbol, respectively.
, respectively. The colored markers in panels (b)–(m) are the same as those in panel (a) and indicate the time at which the quantities are shown. The primary core and companion are again marked by a “x” and “+” symbol, respectively.
Current usage metrics show cumulative count of Article Views (full-text article views including HTML views, PDF and ePub downloads, according to the available data) and Abstracts Views on Vision4Press platform.
Data correspond to usage on the plateform after 2015. The current usage metrics is available 48-96 hours after online publication and is updated daily on week days.
Initial download of the metrics may take a while.