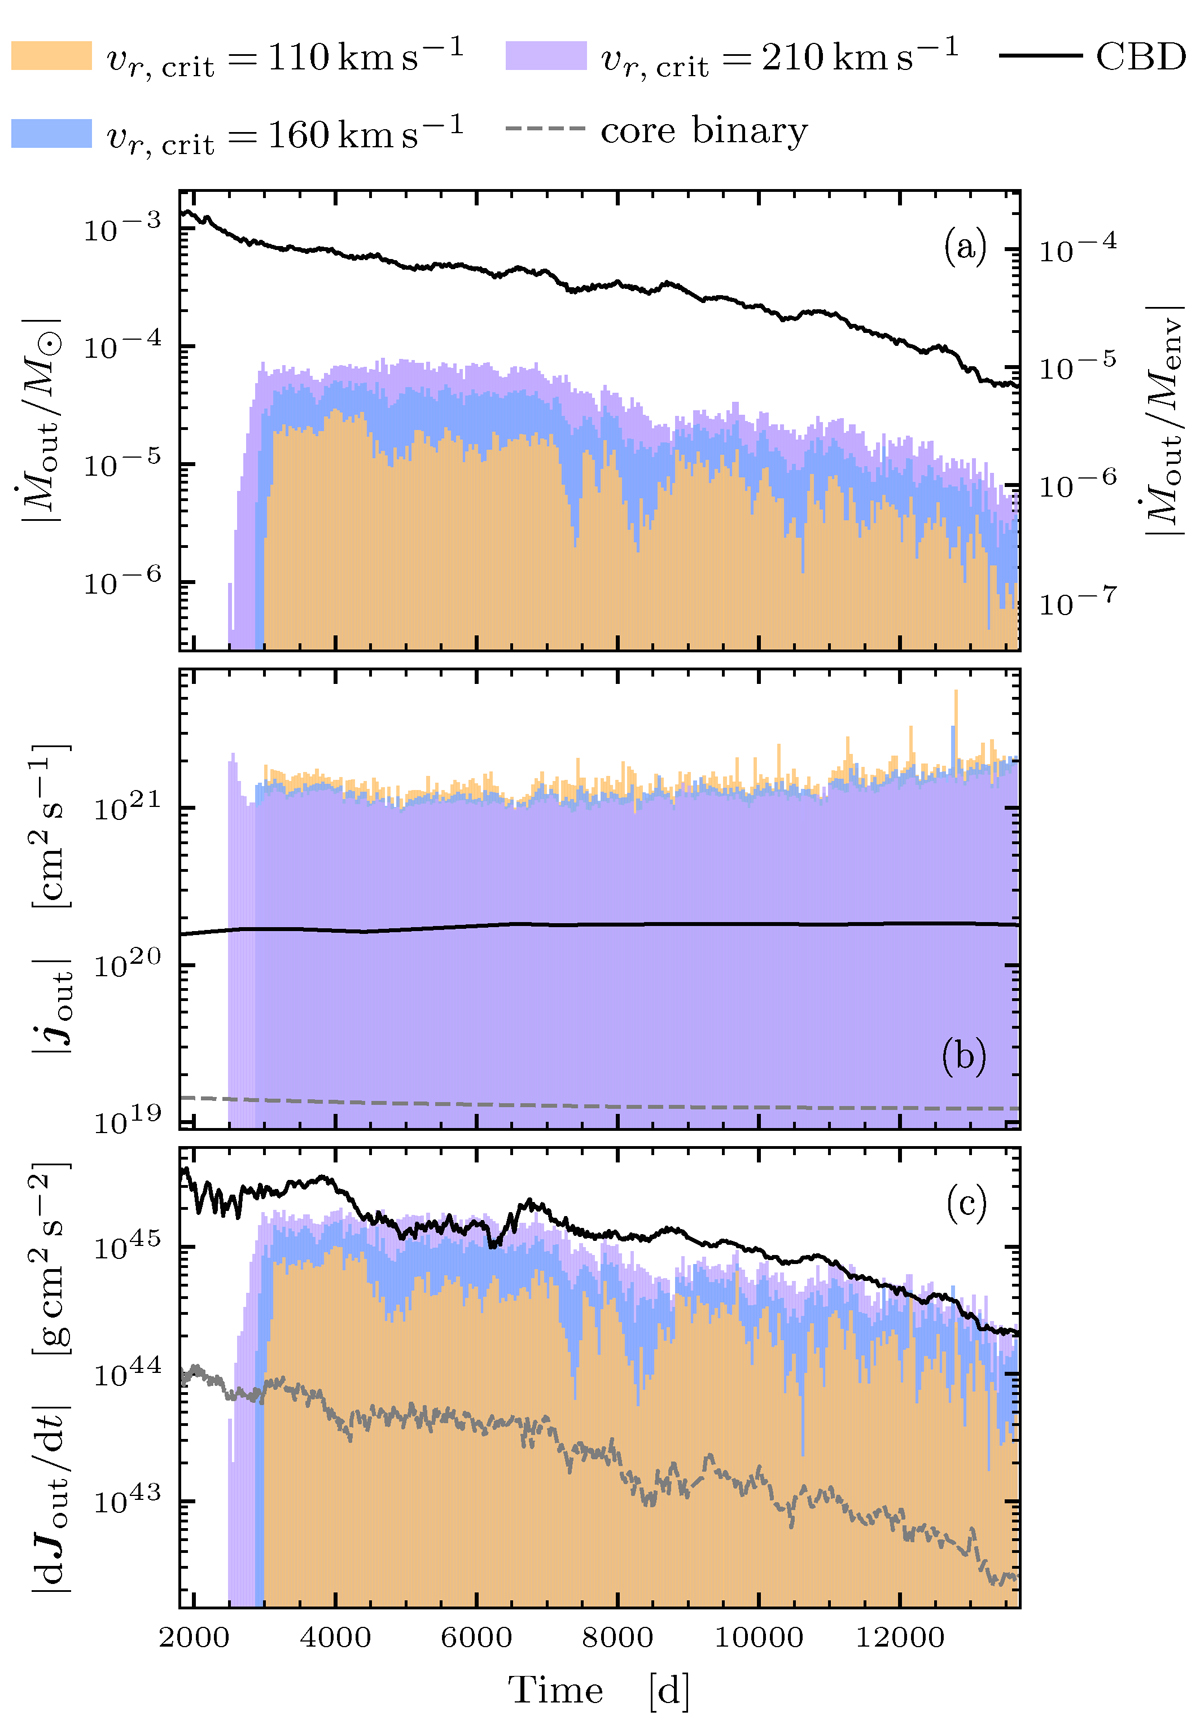
Fig. 11.
Download original image
Time evolution of quantities carried away by the launched tracer particles in the polar direction. Shown are the mass-loss rate Ṁout in (a), the specific angular momentum |jout| in (b) and the angular momentum loss rates |dJout/dt| in (c). The colors represent the different critical radial velocities introduced in Sect. 3.4 of vr, crit = 110, 160 and 210 kms−1 in purple, blue and orange, respectively. We additionally show the respective quantities for the CBD in black and for the core binary in dashed gray. With the subscript “out”, we specifically highlight, that the rates shown in this plot are obtained through loss rates of tracer particles passing a control surface within a time window of 42 d (see Sect. 3.4 for more details).
Current usage metrics show cumulative count of Article Views (full-text article views including HTML views, PDF and ePub downloads, according to the available data) and Abstracts Views on Vision4Press platform.
Data correspond to usage on the plateform after 2015. The current usage metrics is available 48-96 hours after online publication and is updated daily on week days.
Initial download of the metrics may take a while.