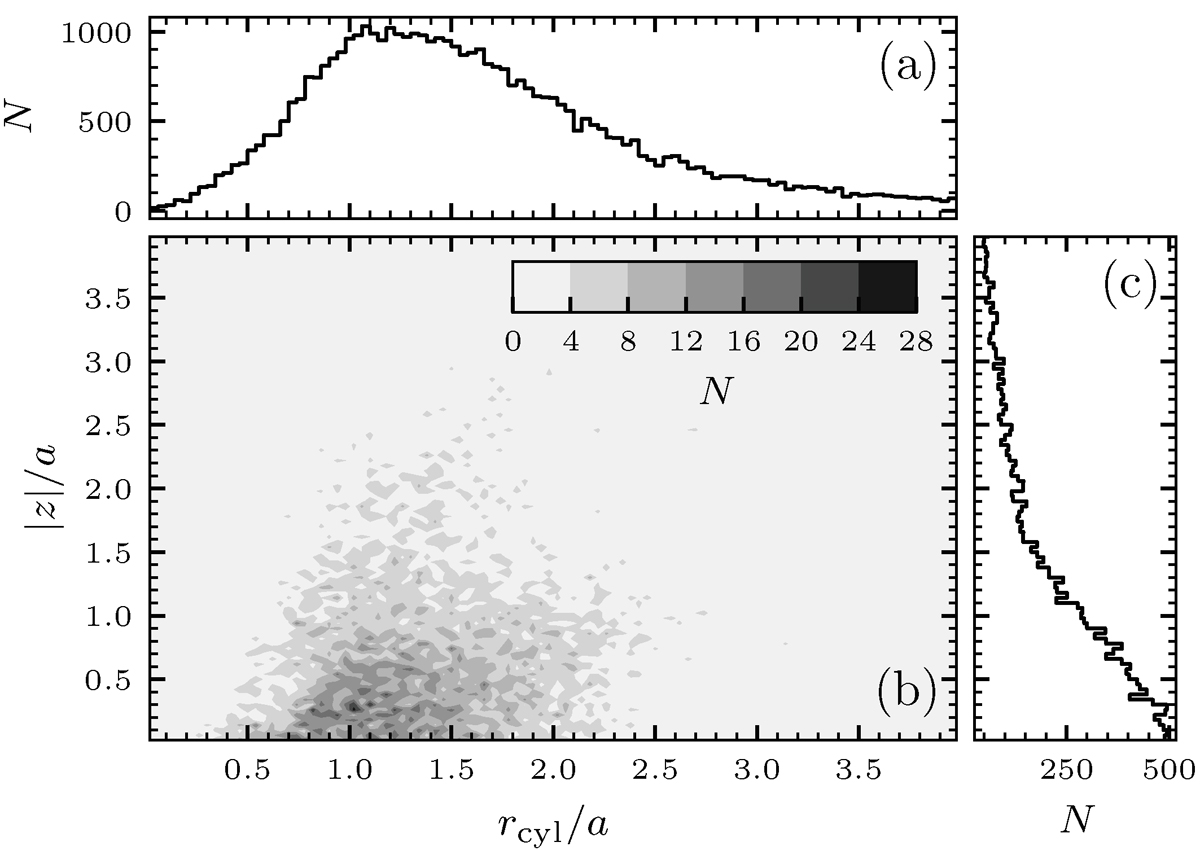
Fig. 10.
Download original image
Corner plot of the launching position for all tracer particles exceeding a critical velocity of vr = 110 km s−1 (for the selection process, see Sect. 3.4). In (b), we show the number of tracer particles launched at a given vertical (|z|/a) and cylindrical radial distance (rcyl/a) from the center of mass of the core binary, normalized by the orbital separation at the time of acceleration. In (a) and (c), the marginalized distributions are shown. The mode of the smoothed distribution (piecewise interpolated with a cubic polynomial) in the radial direction is at 1.1a (i.e., the radius with the highest probability for a tracer particle to be launched).
Current usage metrics show cumulative count of Article Views (full-text article views including HTML views, PDF and ePub downloads, according to the available data) and Abstracts Views on Vision4Press platform.
Data correspond to usage on the plateform after 2015. The current usage metrics is available 48-96 hours after online publication and is updated daily on week days.
Initial download of the metrics may take a while.