Fig. C.2.
Download original image
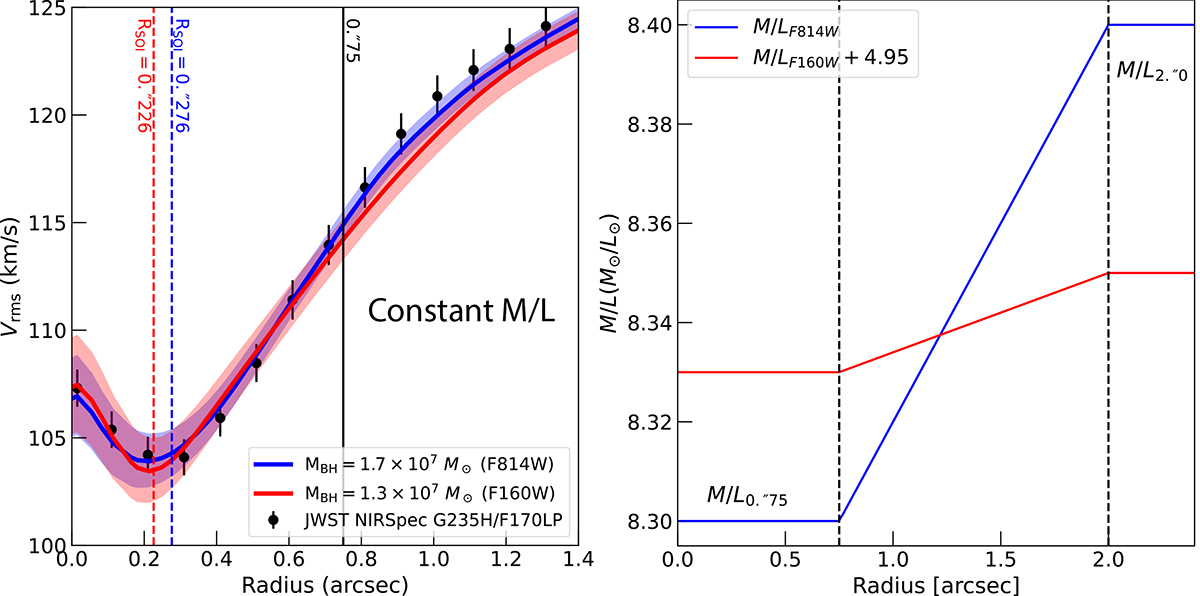
Left: Comparison of the stellar kinematics measured from NIRSpec G235H/F170LP observations and the best-fit JAM (with 1σ error) with a constant M/LF814W (solid blue line) and M/LF160W (solid red line). Discrepancies between the data and model are apparent beyond ![]() , as marked by the dash vertical line. Right: Best-fit radially varying M/LF814W profile (described in Sect. 2; solid blue line). It exhibits a step-like characteristic with
, as marked by the dash vertical line. Right: Best-fit radially varying M/LF814W profile (described in Sect. 2; solid blue line). It exhibits a step-like characteristic with ![]() M⊙/L⊙ at
M⊙/L⊙ at ![]() and
and ![]() /L⊙ at
/L⊙ at ![]() . Between these radii, the M/LF814W profile increases linearly. Similarly, for the best-fit radially varying M/LF160W profile (Appendix D; solid red line), we adopt
. Between these radii, the M/LF814W profile increases linearly. Similarly, for the best-fit radially varying M/LF160W profile (Appendix D; solid red line), we adopt ![]() /L⊙ at
/L⊙ at ![]() and
and ![]() /L⊙ at
/L⊙ at ![]() . Here, the M/LF160W profile is vertically offset by a value of 4.95 M⊙/L⊙ for visualization.
. Here, the M/LF160W profile is vertically offset by a value of 4.95 M⊙/L⊙ for visualization.
Current usage metrics show cumulative count of Article Views (full-text article views including HTML views, PDF and ePub downloads, according to the available data) and Abstracts Views on Vision4Press platform.
Data correspond to usage on the plateform after 2015. The current usage metrics is available 48-96 hours after online publication and is updated daily on week days.
Initial download of the metrics may take a while.