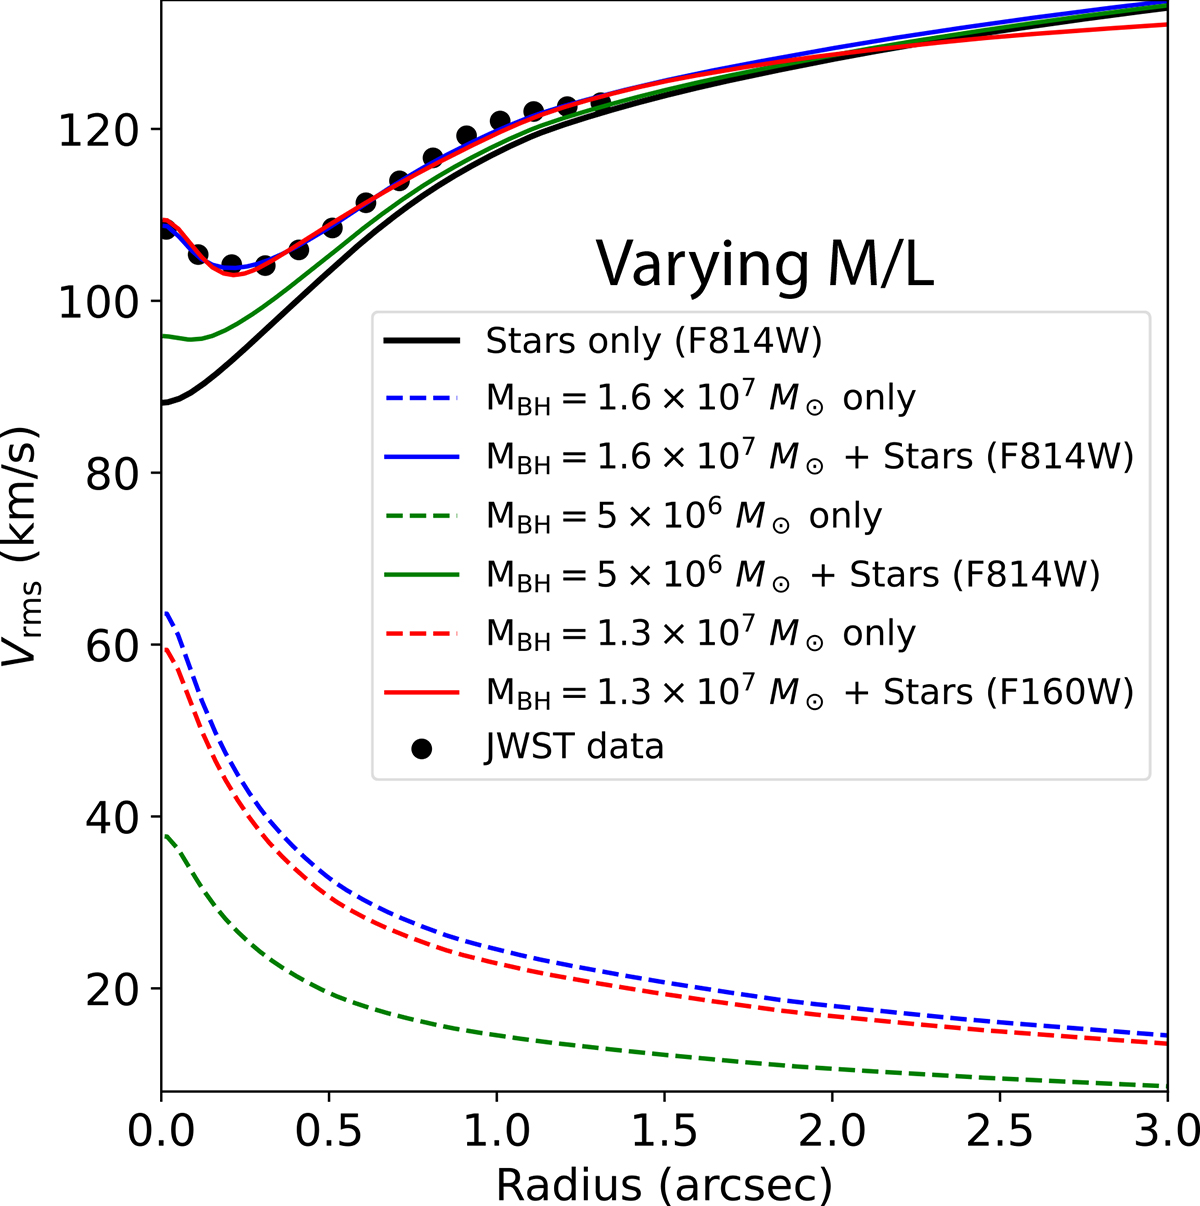
Fig. D.3.
Download original image
Comparison of the 1D Vrms profiles from the best-fit JAM model with radially varying M/L profiles and MBH = 1.6 × 10⁷ M⊙ (using the F814W stellar-mass model; solid red line, ![]() ) or MBH = 1.3 × 10⁷ M⊙ (using the F160W stellar-mass model; solid blue line,
) or MBH = 1.3 × 10⁷ M⊙ (using the F160W stellar-mass model; solid blue line, ![]() ) and an alternative model with MBH = 5 × 10⁶ M⊙ (solid green line) against the JAM model with MBH = 0 M⊙ (solid black line) within a radial extent of 3″. Despite the small SOI of the SMBH (
) and an alternative model with MBH = 5 × 10⁶ M⊙ (solid green line) against the JAM model with MBH = 0 M⊙ (solid black line) within a radial extent of 3″. Despite the small SOI of the SMBH (![]() ), our best-fit MBH model exhibits a kinematic imprint extending across the NIRSpec FoV (
), our best-fit MBH model exhibits a kinematic imprint extending across the NIRSpec FoV (![]() ) compared to the JAM model without a black hole (which accounts only for the stellar mass component). This results in a systematic increase in Vrms by approximately ΔVrms ≈ 2 km s−1, with the shift becoming more pronounced for higher MBH values, as shown in Figs. 2 and D2. For reference, an SMBH at the lowest mass limit detectable by NIRSpec high-spectral-resolution observations using stellar dynamical techniques (MBH, min = 5 × 10⁶ M⊙ claimed in this work; Sect. 4) does not produce a visible kinematic effect beyond
) compared to the JAM model without a black hole (which accounts only for the stellar mass component). This results in a systematic increase in Vrms by approximately ΔVrms ≈ 2 km s−1, with the shift becoming more pronounced for higher MBH values, as shown in Figs. 2 and D2. For reference, an SMBH at the lowest mass limit detectable by NIRSpec high-spectral-resolution observations using stellar dynamical techniques (MBH, min = 5 × 10⁶ M⊙ claimed in this work; Sect. 4) does not produce a visible kinematic effect beyond ![]() .
.
Current usage metrics show cumulative count of Article Views (full-text article views including HTML views, PDF and ePub downloads, according to the available data) and Abstracts Views on Vision4Press platform.
Data correspond to usage on the plateform after 2015. The current usage metrics is available 48-96 hours after online publication and is updated daily on week days.
Initial download of the metrics may take a while.